Download
1 / 1
10 likes | 135 Views
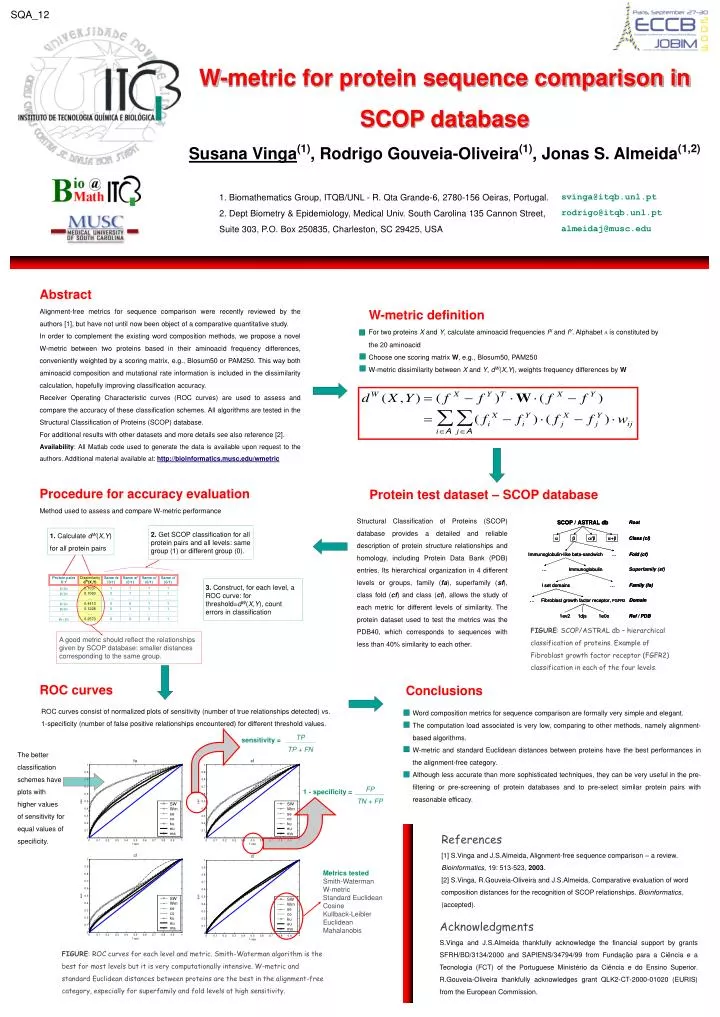
TP. sensitivity =. TP + FN. FP. 1 - specificity =. TN + FP. W-metric definition. For two proteins X and Y , calculate aminoacid frequencies f X and f Y . Alphabet A is constituted by the 20 aminoacid Choose one scoring matrix W , e.g., Blosum50, PAM250

E N D
TP sensitivity = TP + FN FP 1 - specificity = TN + FP W-metric definition For two proteins X and Y, calculate aminoacid frequencies fX and fY. Alphabet A is constituted by the 20 aminoacid Choose one scoring matrix W, e.g., Blosum50, PAM250 W-metric dissimilarity between X and Y, dW(X,Y), weights frequency differences by W Procedure for accuracy evaluation Method used to assess and compare W-metric performance 2.Get SCOP classification for all protein pairs and all levels: same group (1) or different group (0). 1. Calculate dW(X,Y) for all protein pairs 3.Construct, for each level, a ROC curve: for threshold=dW(X,Y), count errors in classification A good metric should reflect the relationships given by SCOP database: smaller distances corresponding to the same group. ROC curves Conclusions ROC curves consist ofnormalized plots of sensitivity (number of true relationships detected) vs. 1-specificity (number of false positive relationships encountered) for different threshold values. Word composition metrics for sequence comparison are formally very simple and elegant. The computation load associated is very low, comparing to other methods, namely alignment-based algorithms. W-metric and standard Euclidean distances between proteins have the best performances in the alignment-free category. Although less accurate than more sophisticated techniques, they can be very useful in the pre-filtering or pre-screening of protein databases and to pre-select similar protein pairs with reasonable efficacy. The better classification schemes have plots with higher values of sensitivity for equal values of specificity. Metrics tested Smith-Waterman W-metric Standard Euclidean Cosine Kullback-Leibler Euclidean Mahalanobis FIGURE: ROC curves for each level and metric. Smith-Waterman algorithm is the best for most levels but it is very computationally intensive. W-metric and standard Euclidean distances between proteins are the best in the alignment-free category, especially for superfamily and fold levels at high sensitivity. SQA_12 W-metric for protein sequence comparison in SCOP database Susana Vinga(1), Rodrigo Gouveia-Oliveira(1), Jonas S. Almeida(1,2) svinga@itqb.unl.pt rodrigo@itqb.unl.pt almeidaj@musc.edu • 1. Biomathematics Group, ITQB/UNL - R. Qta Grande-6, 2780-156 Oeiras, Portugal. • 2. Dept Biometry & Epidemiology, Medical Univ. South Carolina 135 Cannon Street, Suite 303, P.O. Box 250835, Charleston, SC 29425, USA Abstract Alignment-free metrics for sequence comparison were recently reviewed by the authors [1], but have not until now been object of a comparative quantitative study. In order to complement the existing word composition methods, we propose a novel W-metric between two proteins based in their aminoacid frequency differences, conveniently weighted by a scoring matrix, e.g., Blosum50 or PAM250. This way both aminoacid composition and mutational rate information is included in the dissimilarity calculation, hopefully improving classification accuracy. Receiver Operating Characteristic curves (ROC curves) are used to assess and compare the accuracy of these classification schemes. All algorithms are tested in the Structural Classification of Proteins (SCOP) database. For additional results with other datasets and more details see also reference [2]. Availability: All Matlab code used to generate the data is available upon request to the authors. Additional material available at: http://bioinformatics.musc.edu/wmetric Protein test dataset – SCOP database Structural Classification of Proteins (SCOP) database provides a detailed and reliable description of protein structure relationships and homology, including Protein Data Bank (PDB) entries. Its hierarchical organization in 4 different levels or groups, family (fa), superfamily (sf), class fold (cf) and class (cl), allows the study of each metric for different levels of similarity. The protein dataset used to test the metrics was the PDB40, which corresponds to sequences with less than 40% similarity to each other. FIGURE: SCOP/ASTRAL db – hierarchical classification of proteins. Example of Fibroblast growth factor receptor (FGFR2) classification in each of the four levels. References [1] S.Vinga and J.S.Almeida, Alignment-free sequence comparison – a review. Bioinformatics, 19: 513-523, 2003. [2] S.Vinga, R.Gouveia-Oliveira and J.S.Almeida, Comparative evaluation of word composition distances for the recognition of SCOP relationships. Bioinformatics, (accepted). Acknowledgments S.Vinga and J.S.Almeida thankfully acknowledge the financial support by grants SFRH/BD/3134/2000 and SAPIENS/34794/99 from Fundação para a Ciência e a Tecnologia (FCT) of the Portuguese Ministério da Ciência e do Ensino Superior. R.Gouveia-Oliveira thankfully acknowledges grant QLK2-CT-2000-01020 (EURIS) from the European Commission.