Download
1 / 40
410 likes | 703 Views
Traffic Anomaly Detection. Nick Feamster CS 7260 February 20, 2006. Administrivia. Problem Set 2 Due Friday Quiz next Monday Open everything (notes, Web, etc.) Handful of reading questions 1-2 “Design Questions” based on things we’ve learned. Traffic Anomaly Detection: Motivation.

E N D
Traffic Anomaly Detection Nick FeamsterCS 7260February 20, 2006
Administrivia • Problem Set 2 Due Friday • Quiz next Monday • Open everything (notes, Web, etc.) • Handful of reading questions • 1-2 “Design Questions” based on things we’ve learned
Traffic Anomaly Detection: Motivation Many “actionable” changes to traffic patterns • DDoS attacks • Routing anomalies • Link failures • Flash crowds • …
Traditional Network Traffic Analysis Gap between Capabilities and Goals • Focus on • Short ‘stationary’ timescales • Traffic on a single link in isolation • Principal results • Scaling properties • Packet delays and losses What ISPs Care About • Focus on • Long, nonstationary timescales • Traffic on all links simultaneously • Principal goals • Anomaly detection • Traffic engineering • Capacity planning
Network-Wide Traffic Analysis • Anomaly Detection:Which links show unusual traffic? • Traffic Engineering: How does traffic move throughout the network? • Capacity planning: How much and where in network to upgrade?
This is Complicated • Measuring and modeling traffic on all links simultaneously is challenging. • Even single link modeling is difficult • 100s of links in large IP networks • High-Dimensional timeseries • Significant correlation in link traffic
Origin-Destination Flows total traffic on the link • Link traffic arises from the superposition of Origin-Destination (OD)flows • A fundamental primitive for whole-network analysis traffic time
How to Analyze OD Flows? • Even more OD flows than links • Still a high dimensional, multivariate timeseries • How do we extract meaning from this high dimensional structure in a systematic manner?
Dimensionality Reduction • Look for good low-dimensional representations • A high-dimensional structure can be explained by a small number of independent variables • A commonly used technique: Principal Component Analysis (PCA)(aka KL-Transform, SVD, …)
Summary • Measure complete sets of OD flow timeseries from two backbone networks • Use PCA to understand their structure • Decompose OD flows into simpler features • Characterize individual features • Reconstruct OD flows as sum of features • Call this structural analysis
Example OD Flows Some have visible structure, some less so…
Structural Analysis • Are there low dimensional representations for a set of OD flows? • Do OD flows share common features? • What do the features look like? • Can we get a high-level understanding of a set of OD flows in terms of these features?
x1 , x2 u1 , u2 Principal Component Analysis Coordinate transformation method Original Data Transformed Data PC2 PC1 x2 PC2 x2 u2 u1 u2 PC1 u1 x1 x1
Properties of Principle Components • Each PC in the direction of maximum (remaining) energy in the set of OD flows • Ordered by amount of energy they capture • Eigenflow: set of OD flows mapped onto a PC; a common trend • Ordered by most common to least common
OD flow X: OD flow matrix U: Eigenflowmatrix V: Principalmatrix PCA on OD flows # OD pairs # OD pairs # OD pairs time time # OD pairs Eigenflow PC
; = + + PCA on OD flows (2) Each eigenflow is a weighted sum of all OD flows Eigenflows are orthonormal = Singular values indicate the energy attributable to a principal component Each OD flow is weighted sum of all eigenflows
Low Dimensionality of OD Flows Small number of PCs capture most of signal’s structure Plot of OD flow energy captured by each dimension. Energy captured Principal Components
Structure of OD Flows Most OD flows have less than 20 significant eigenflows Can think of each OD flow as having only a small set of “features”
Reasons for Low Dimensionality • Generally, traffic on different links is dependent • Link traffic is the superposition of origin-destination flows (OD flows) • The same OD flow passes over multiple links, inducing correlation among links • All OD flows tend to vary according to common daily and weekly cycles, and so are themselves correlated
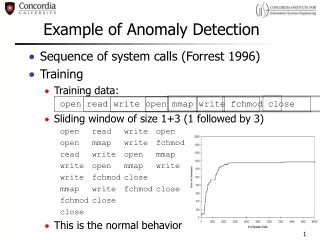
Kinds of Eigenflows Noise n-eigenflows Spike s-eigenflows Deterministic d-eigenflows Roughly stationary and Gaussian Sudden, isolated spikes and drops Periodic trends
An OD Flow, Reconstructed OD flow D-components S-components N-components
Application: Anomaly Detection • Is my network experiencing unusual conditions? • Then, adopt the following framework • DetectionIs there an unusual event? • IdentificationWhich of the possible explanations fits best? • QuantificationHow serious is the problem?
Statistical Approach The advantage of such a framework is that it lends itself to a statistical approach: • Detection: Outlier detection • Identification: Hypothesis testing • Quantification: Estimation AnomalyDiagnosis
State of the Art • Much previous work in anomaly detection, attack detection, and traffic characterization • Previous work has • Relied on rules and heuristics • Not taken a general approach • Almost exclusively concentrated on measurements from individual links
Whole-Network Diagnosis Effective diagnosis of network anomalies requires a whole-network approach For example, diagnosing traffic anomalies requires analyzing traffic from all links
How to extract meaning from such a high-dimensional data in a systematic manner? Complicated! • Need to study traffic from all links in a network simultaneously • Large amount of data • Traffic is nonstationary • Varying link utilization levels • 100s of links High dimensionality
Low Intrinsic Dimensionality of Link Traffic Key result: Normal traffic is well approximated by a low dimensional space For example: Traffic on 40+ links is well approximated in space of only 4 dimensions
Anomaly Detection: Subspace Method • An approach to separate normal from anomalous traffic • Define as the space spanned by the first k principal components • Define as the space spanned by the remaining principal components • Then, decompose traffic on all links by projecting onto and to obtain: Residual trafficvector Traffic vector of all links at a particular point in time Normal trafficvector
y The Subspace Method, Geometrically In general, anomalous traffic results in a large value of Traffic on Link 2 Traffic on Link 1
Diagnosing Volume Anomalies • A volume anomaly is a sudden change in an OD flow’s traffic (i.e., point to point traffic) • Problem: Given link traffic measurements, diagnose the volume anomalies
An Illustration Sprint-Europe Backbone Network The Diagnosis Problem requires analyzing traffic on all links to: 1) Detect the time of the anomaly 2) Identify the source & destination 3) Quantify the size of the anomaly
Subspace Method: Detection • Error Bounds on Squared Prediction Error: • Assuming multivariate Gaussian data, traffic is normal when, Result due to [Jackson and Mudholkar, 1979] Traffic on Link 2 Traffic on Link 1
SPE vs. All Traffic Value of over time Value of over time SPE () at anomaly time points clearly stand out
Subspace Method: Identification • An anomaly causes a displacement of the state vector away from • The direction of the displacement gives information about the nature of the anomaly • Intuition: find the hypothesis that best describes a detected anomaly • Select the OD flow that accounts for maximum residual traffic
Identification: Hypothesis Testing • Denote the set of all anomalies • Each anomaly adds traffic in some way • So in the presence of anomaly : • And the best estimate of is found by minimizing the distance to in the direction of the anomaly
A Geometric Illustration Normal Subspace
Selecting the Best Hypothesis 1. For each hypothesized anomaly compute as: 2. Select anomaly as In this manner, select the anomaly that accounts for maximum residual traffic
Subspace Method: Quantification • Given hypothesized anomaly , quantification is straightforward • Estimated per-link anomaly traffic is • And the portion due to the anomaly is