Download
1 / 44
460 likes | 716 Views
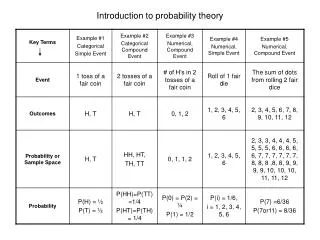
Introduction to Probability theory and statistical inference. Observations and random experiments. Observations. Observation random experiment (controlled) Outcome cannot be predicted with certainty Range of possible outcomes known

E N D
Observations • Observation random experiment (controlled) • Outcome cannot be predicted with certainty • Range of possible outcomes known • Outcomes are not equally likely: with each outcome may be associated a probability • Continuous variable: probability density • Discrete variable: probability mass • Distribution of probabilities: probability distribution
Observations • With each outcome of an observation may be associated a value: random variable • Random variable takes on its values by chance (uncertainty) • Outcome of observation and value of random variable cannot be predicted with certainty, but distribution of possible values known
Random variable • Takes on value by chance • Not all values are equally likely. They follow particular distribution • Expected value • Spread around expected value (variance) • The parameters of the distribution are related to systematic factors • Expected value of R.V. depends on systematic component • Value of R.V. depends on systematic component and chance
Random variableExamples • Presence of personal attribute • Occurrence of event • Number of events during specified period • Time (age) at first, second, third, etc. occurrence of specified event • Attribute after occurrence of event (destination state) • Gain/loss due to a specified event
Prediction • To predict an observation, we use a model: probability model • Probability models without covariates • Probability models with covariates (predictor variables) • The probability model predicts the probability of a given outcome of observation • Outcome cannot be predicted with certainty; probability of outcome can be predicted
Statistical inference • Parameters of probability model are estimated from observations (data) • Parameters of probability model Regression model
Continuousrandom variables • Normal r.v. probit model • Logistic r.v. logit model • Exponential r.v. event count model
Normal distribution: density With the mean and 2 the variance
Standard normal density The probit model relies on a standard normal distribution (cumulative)
SPSS linear regression: y = a + b x 1 = 24.3 for males 2 = 24.3 - 3.1 = 21.2 for females
Standard logistic distribution Cumulative distribution: Probability density function: With the linear predictor ‘Standard’ logistic distribution with mean 0 and variance 2 = 2/3 3.29 The logit model relies on a standard logistic distribution (variance 1 !)
‘Standardised’ logistic distribution Cumulative distribution: Probability density function: =/3 1.8138 Standardized logistic with mean 0 and variance 1
Link functions Translate probability scale (0,1) into real number scale (-,+ ) Logit E.g. logit(0.25) = -1.0986 logit(0.1235) = -1.96 Probit E.g. (z) = 0.025 for z = -1.96 Probit(0.025) = -1.96
Exponential distribution Probability density function Distribution function Number of events during interval: Poisson distribution
Nominal variable:categories cannot be ordered • Binomial: two possible values (categories, states) • Multinomial: more than two possible values (categories, states) • multistate = multinomial
Bernoulli random variable • Binary outcome: two possible outcomes • Random experiment: Bernoulli trial (e.g. toss a coin: head/tail) • Attribute present/absent • Event did occur/did not occur during interval • Success/failure
Bernoulli random variable • Binary random variable: coding • 0 and 1: reference category gets 0 (dummy coding; contrast coding) • Model parameters are deviations from reference category. • -1 and +1 (effect coding: mean is reference category) • Model parameters are deviations from the mean. • 1 and 2, etc. INTERPRETATION Vermunt, 1997, p. 10
Bernoulli random variable • Parameter of Bernoulli distribution: expected value of ‘success’: p • Variance: p(1-p) = pq • Bernoulli process: sequence of independent Bernoulli observations (trials) in homogeneous population [identical B. trials](e.g 30 observations) • 10 1 1 0 0 0 1 1 1 1 0 1 0 1 0 1 1 0 1 0 1 1 0 0 1 1 1 0 1
Binomial distribution • COUNT of ‘successes’ in m Bernoulli observations: Nm(Binomial random variable) • Probability mass function: Binomial distribution with parameter p and index m Number of observations is fixed (m)
Binomial distribution • Expected number of ‘successes’: E[Nm]=mp • Variance of Nm: Var [Nm]=mp(1-p) • Binomial variance is smaller than the mean • For one of m observations: • Expected value: p • Variance: Var[Nm/m] = Var[Nm]/m2 = [p(1-p)]/m • Variance decreases with number of observations
Multinomial random variable • Polytomous random variable: more than two possible outcomes • Random experiment: e.g. toss a die (6 possible outcomes) • Attribute (e.g marital status, region of residence) • Sequence of independent observations (trials) in homogeneous population [identical trials](e.g 30 observations, each observation has 3 possible outcomes) • 1 2 1 3 2 3 1 3 1 2 2 2 3 1 1 3 2 3 3 1 2 1 1 2 2 3 1 1 2 2 • (11 times obs. 1; 11 times obs. 2; 8 times obs. 3)
Multinomial distribution • Two categories (binomial): Binomial distribution with parameters 1 and2and index m with m = n1+n2
Multinomial distribution • Several categories: I possible outcomes With I the number of categories, m the number of observations, ni the number of observations in category/state i and i the probability of an observation being in category I (parameter) [state probability].
Multinomial distribution • Expected number in category i: E[Ni]=mi • Variance of Ni: Var [Ni]= mi(1- i) • Multinomial variance is smaller than the mean • Covariance: Cov[NiNk] = -mi k • For one of m observations: • Expected value: i • Variance: Var[Ni/m] = Var[Ni]/m2 = [i(1- i)]/m • Variance decreases with number of observations
Poisson distribution • Number of events or occurrences of type i during given period (number of observations not fixed) • Probability mass function: With ni given number of observations of type i during unit interval, i the expected number of observations during unit interval (parameter).
Poisson distribution • Expected number of events: E[Ni] = i • Variance of Ni: Var[Ni] = i • Equality of mean and variance is known as equidispersion • Variance greater than mean is known as overdispersion • Wheni increases, Poisson distribution approximates normal distribution with mean i and variance i . • Binomial distribution with parameter p and index m converges to Poisson distribution with parameter if m and p 0 (rare events).
Overdispersion is problem for random variables where variance is related to the mean e.g. binomial, Poisson Normal random variable has a separate parameter for dispersion (spread around the mean)
Binomial r.v. Poisson r.v. Let p = /m
Let m and for k = 0, 1, 2, ... Hence Taylor and Karlin, 1994, p. 29
Poisson r.v. Binomial r.v. Let Joint distribution of Ni conditional on N = n (total fixed): With = 1 + 2 Hence
Ni follows Poisson distribution with parameter i = pi with pi = i / Ni are independent Poisson r.v. and pi can be estimated independently (Sen and Smith, 1995, p. 372) = expected number of events in unit time interval (RATE) pi = probability that event occurs in category (state) i Poisson - binomial Poisson - multinomial
Poisson r.v. Hypergeometric r.v. Two-way table, marginal totals fixed: Poisson becomes a hypergeometric distribution. When one cell value is known, all cell values are known. With binomial coefficient: E.g. Agresti, 1996, p. 39