Download
1 / 31
310 likes | 386 Views
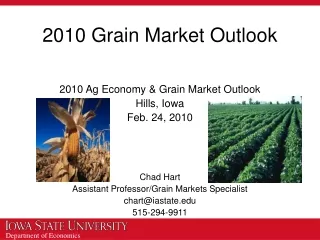
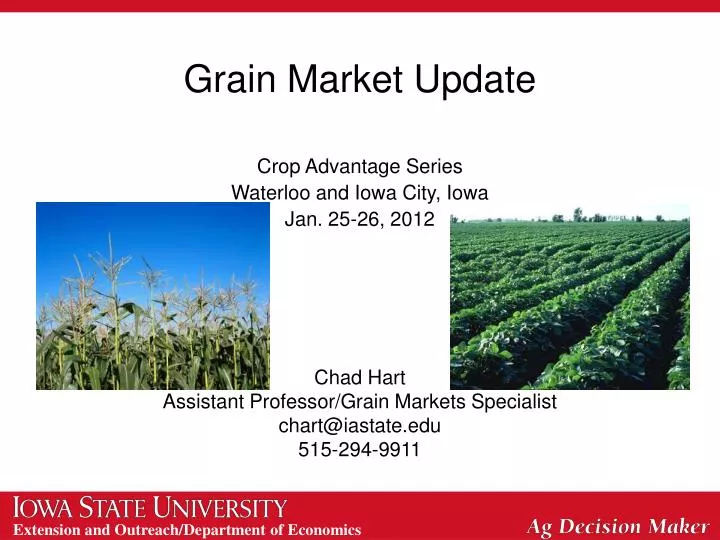
Grain Market Update. Crop Advantage Series Waterloo and Iowa City, Iowa Jan. 25-26, 2012 Chad Hart Assistant Professor/Grain Markets Specialist chart@iastate.edu 515-294-9911. U.S. Corn Supply and Use. Source: USDA-WAOB. U.S. Soybean Supply and Use. Source: USDA-WAOB. 2011 Corn Yields.

E N D
Grain Market Update Crop Advantage Series Waterloo and Iowa City, Iowa Jan. 25-26, 2012 Chad Hart Assistant Professor/Grain Markets Specialist chart@iastate.edu 515-294-9911
U.S. Corn Supply and Use Source: USDA-WAOB
U.S. Soybean Supply and Use Source: USDA-WAOB
2011 Corn Yields Source: USDA-NASS
2011 Soybean Yields Source: USDA-NASS
World Corn Production Source: USDA-WAOB
World Soybean Production Source: USDA-WAOB
South American Precipitation Source: USDA-NASS & WAOB
Corn vs. Wheat Source: CME Group, 1/24/2012
Hog Crush Margin The Crush Margin is the return after the pig, corn and soybean meal costs. Carcass weight: 200 pounds Pig price: 50% of 5 mth out lean hog futures Corn: 10 bushels per pig Soybean meal: 150 pounds per pig Source: Shane Ellis, ISU Extension
Cattle Crush Margin The Crush Margin is the return after the feeder steer and corn costs. Live weight: 1250 pounds Feeder weight: 750 pounds Corn: 50 bushels per head Source: Shane Ellis, ISU Extension
Corn Export Shifts Source: USDA-FAS
Soy Export Shifts Source: USDA-FAS
Corn Grind for Ethanol Source: DOE-EIA
Principal Crop Area Source: USDA-NASS
States with Room to Grow Number is the difference in planted acres between 2008 and 2011
Current Corn Futures 5.86 5.46 5.35 5.31 Source: CME Group, 1/10/2012
Current Soybean Futures 11.72 11.62 11.50 11.51 Source: CME Group, 1/10/2012
Thoughts for 2012 and Beyond • General economic conditions • Continued worldwide economic recovery is a major key for crop prices • US job recovery, European financial concerns • Supply/demand concerns • Smaller than anticipated U.S. crops, worries about dry conditions • Biofuel growth and energy demand • Corn has the upper hand in the acreage competition • Will supply be able to keep pace with demand? • 2011/12: USDA: Corn $6.20; Soy $11.70 • Futures (as of 1/24/12): Corn $5.86; Soy $11.62 • 2012/13: Futures (as of 1/24/12): Corn $5.46; Soy $11.72
Thank you for your time!Any questions?My web site:http://www.econ.iastate.edu/~chart/Iowa Farm Outlook:http://www.econ.iastate.edu/ifo/Ag Decision Maker:http://www.extension.iastate.edu/agdm/