Download
1 / 48
480 likes | 656 Views
CEE 8095 Georgia Institute of Technology February 22, 2006 REGIONAL ATMOSPHERIC POLLUTION AND TRANSBOUNDARY AIR QUALITY MANAGEMENT Annu. Rev. Environ. Resour. 2005. 30:1–37 Michelle S. Bergin Georgia Inst. of Tech., Dept. of Civil and Environmental Engineering

E N D
CEE 8095 Georgia Institute of Technology February 22, 2006 REGIONAL ATMOSPHERIC POLLUTION AND TRANSBOUNDARY AIR QUALITY MANAGEMENT Annu. Rev. Environ. Resour. 2005. 30:1–37 Michelle S. Bergin Georgia Inst. of Tech., Dept. of Civil and Environmental Engineering J. Jason West Princeton University, Program in Atmospheric and Oceanic Sciences and Woodrow Wilson School of Public and International Affairs Terry J. Keating U.S. EPA, Office of Air and Radiation Armistead G. Russell Georgia Inst. of Tech., Dept. of Civil and Environmental Engineering
Overview • GENERAL CHARACTERISTICS OF REGIONAL ATMOSPHERIC TRANSPORT AND CHEMISTRY • REGIONAL AIR POLLUTANTS AND EFFECTS • Acid Deposition • Tropospheric Ozone • Particulate Matter • Mercury • Persistent Organic Pollutants • Regional Climate Change • A unified view • MANAGEMENT OF REGIONAL TRANSBOUNDARY AIR POLLUTION • Examples of Transboundary Air Quality Management Regimes and Approaches • Achieving Successful Regimes for Transboundary Air Pollution • Assessment of Existing International Regional Regimes M. Bergin GA Instit. of Technol.
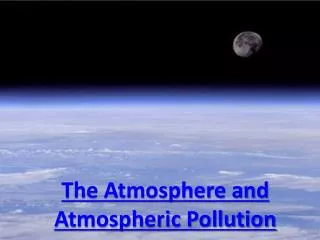
Air Pollution Impacts • Current estimates are that a quarter of the world’s population is exposed to unhealthy ambient air pollutants, with nearly 6.4 million years of healthy life lost owing to long-term exposure to ambient particulate matter alone. (World Health Organ. 2003, 2004) • Air pollution damages crops, built structures such as buildings and historic monuments, ecosystems, and wildlife. • Pollutants currently in the atmosphere are likely causing large scale changes in the Earth’s basic systems such as climate and ocean dynamics. M. Bergin GA Instit. of Technol.
Several important air pollutants are widely recognized to be transported over scales from about 100 to a few 1000s of kilometers, large enough to cross state, provincial, national, and even continental boundaries. Managing these regional pollutants requires overcoming political, economic, and cultural differences to establish cooperation between multiple jurisdictions. Effective pollution reduction requires an understanding of the linkages between pollutants and of their impacts at different geographic scales. Regional Air Pollution M. Bergin GA Instit. of Technol.
Regional Air Pollution Management • Transboundary air pollution is common. • Its damage is extensive. • Political cooperation necessary to mitigate the damage and avoid potential future damage. GOALS • Develop integrated control strategies incorporating • multiple linkages between pollution problems • multiple scales of pollutant impacts • multiple benefits of alternative technology and behavioral choices • linkages between air pollution and economic development, energy, agriculture, transportation, and trade policies. • Enable all affected parties to reach agreements to implement these control strategies. M. Bergin GA Instit. of Technol.
GENERAL CHARACTERISTICS OF REGIONAL ATMOSPHERIC TRANSPORT AND CHEMISTRY What determines the geographical extent of a pollutants impacts? • Pollutant • Emission rate and patterns of release (primary or precursors) • Chemistry (formation, intermediates, removal, conditions) • Transport methods • Removal/deposition properties • Atmosphere • Oxidation (HO•), chemistry • Tropospheric vertical mixing (~10 km deep) • Horizontal transport velocity: averaged mean ~ 400 km/day, ranging from a few tens km to about 1000 km • Meteorological patterns (wind, solar intensity, clouds, rain, …) • Geography • Natural emissions • Meteorological patterns • Terrestrial properties • Deposition M. Bergin GA Instit. of Technol.
REGIONAL AIR POLLUTANTS AND EFFECTS • ACID DEPOSITIONdamages or destroys aquatic and terrestrial ecosystems and manufactured materials • TROPOSPHERIC OZONE harms the health of humans and wildlife, damages crops and ecosystems, and is a greenhouse gas • PARTICULATE MATTER harms health, degrades visibility, and changes precipitation and temperature patterns • MERCURY toxic to humans, plants, and animals, and biomagnifies in the food chain • PERSISTENT ORGANIC POLLUTANTS (POPs) toxic, biomagnify, and remain in the environment for many years • REGIONAL CLIMATE CHANGE impacts and is impacted by regional air pollution. M. Bergin GA Instit. of Technol.
1908 1969 Acid Rain Damage www.adirondackcouncil.org/ www.fws.gov M. Bergin GA Instit. of Technol. www.dnr.cornell.edu/.../current_research.htm
Acid Deposition pH of Rain • Natural precipitation: 5.6 (slightly acidic) • Polluted areas: often 3 to 4, lower has been measured • Most aquatic insects, algae, and plankton (base of food chain) cannot tolerate water with a pH below 5.0. A pH below 5.0 can also result in reproductive failures in fish and amphibians. • Acid runoff leaches poisonous metals such as aluminum and mercury from soils and clay, and carries them into water bodies. M. Bergin GA Instit. of Technol.
Observed values of volume-weighted annual average pH of precipitation. Rodhe H, Dentener F, Schulz M. 2002. Environ. Sci. Technol. Annual average pH of rainwater. The most acidified regions occur in eastern North America, Europe, and China. The maximum in South America is associated with emissions from a smelter in northern Chile coupled to low amounts of rainfall in that region.
Spatial Impacts of Acid Deposition The natural pH of water bodies and soils varies considerably depending on the soil composition and buffering capacity of a watershed. These differences explain why some areas are highly susceptible to damage from acid deposition (e.g., lakes in the northeastern United States and the Black Forest in Germany), whereas other areas, such as those with soils rich in lime, are relatively resistant. Patterns of rainfall also help determine where acid is deposited. M. Bergin GA Instit. of Technol.
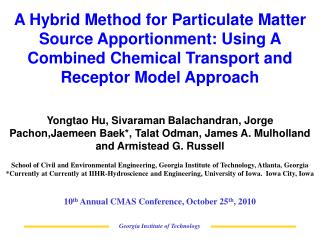
The evolution and unified chemistry of regionalacids, ozone, particulate matter, and mercury. Gases: blue Particulates: green HO•, HO2•: red
Natl. Instit. Public Health Environ. (RIVM), Bilthoven, Neth. 1995. dataset EDGARV32. www.rivm.nl/edgar/model/ims/ NOx from anthropogenic sources in 1995. SO2 from anthropogenic sources in 1995.
Acid Chemistry and Transport • NOx → nitric acid in a few days or less • SO2 → sulfuric acid within several days • Mean transport distances of SO2, NOx, and their oxidation products are approximately 200 to 1200 km before deposition • In addition to direct transport, NOx can form organonitrates that can travel 100s to 1000s of km before converting back to NOx M. Bergin GA Instit. of Technol.
Acid Cooperative Programs • Early 1970s – Cooperative studies under the Organization for Economic Cooperation and Development (Europe) • 1978 National Atmospheric Deposition Program (US) • 1979 Convention on Long-Range Transboundary Air Pollution (originated in Europe) • 1981 Natl. Acid Precipitation Assessment Program (US) • 1990 SO2 Emissions Trading Program (US) • 1991 Canada-United States Air Quality Agreement • 1998 Acid Deposition Monitoring Network in East Asia (EANET) M. Bergin GA Instit. of Technol.
Tropospheric Ozone Concentrations • Clean troposphere: 10 to 40 ppb • Polluted air: 100 to 400 ppb Impacts • Causes acute and chronic health problems, especially related to lung functions, asthma, and pulmonary infection (human). • Accounts for an estimated several billion dollar crop loss every year in the United States alone. • Causes short- and long-term damage to the growth of forest trees and alters the biogenic hydrocarbon emissions of vegetation. • Research is examining effects on sensitive wildlife populations. • Acts as a potent greenhouse gas. M. Bergin GA Instit. of Technol.
One-hour averaged ozone concentration and its sensitivity to a 50% reductions in surface NOx emissions on July 15, 2010 at 4 pm. (Bergin et al., in progress) Ozone sensitivity to surface NOx emissions from VA. Ozone sensitivity to surface NOx emissions from TN.
The evolution and unified chemistry of regionalacids, ozone, particulate matter, and mercury. Gases: blue Particulates: green HO•, HO2•: red
Ozone Removal • Photolytic loss O3 + hn→ O(1D) + O2 and O(1D) +H2O → 2 OH•highest at low altitudes in the tropics • Kinetic reaction HO2• + O3→ OH• + 2 O2 • Deposition takes a few days over land, longer over water. • Ozone and its precursors can be transported over large regions, making it difficult or even impossible for some areas to manage their own concentrations through local emission controls M. Bergin GA Instit. of Technol.
Cooperative regional ozone monitoring and modeling studies • US 1980s – early 1990s • San Joaquin Valley Air Quality Study • Lake Michigan Ozone Study • Regional Ozone Modeling for Northeast Transport • Southern Oxidant Study (SOS) • Southern Appalachian Modeling Initiative (SAMI) • European Experiment on the Transport and Transformation of Environmentally Relevant Trace Constituents in the Troposphere over Europe (EUROTRAC, 1980s and 1990s) • Late 1990s to current: Monitoring of ozone export from the east coast of North America and Asia, and modeling studies of trans-Atlantic and trans-Pacific transport. • Historical measurements and modeling studies suggest that anthropogenic NOx emissions continue to increase global tropospheric ozone concentrations. (Prather et al., 2003; US EPA, 2004) M. Bergin GA Instit. of Technol.
Particulate Matter High-visibility conditions in the Smoky Mountains-100 miles (top) and low-visibility-20 miles (bottom) www.ornl.gov/.../v38_1_05/article02.shtml Clear and Hazy Days in Houston www.utexas.edu/.../texaqs/visitors/photos.html M. Bergin GA Instit. of Technol.
Particulate Matter • Harmful to human and environmental health, degrades visibility, damages built structures, and alters climate. • No threshold has been identified under which particulate matter has no adverse health effects. • In the US, the average visual range in eastern parks has decreased from 90 miles to 15–25 miles, and in western parks from 140 miles to 35–90 miles (US EPA, 2004) • Direct and indirect effects on climate • Evolution of science and policy: TSP → PM10 → PM2.5 M. Bergin GA Instit. of Technol.
The Trimodal Aerosol Distribution Primary and secondary Variable size and composition Mechanical Processes Molecular Processes • Coarse PMLifetimes of minutes to days → transport of less than 10s of km. However, large dust storms and biomassburning events can carry coarse (and fine) particles very long distances. • Fine PMLifetimes of days to weeks → transport 100s to 1000s of km. • In addition to size, hygroscopic properties of the aerosol also determine travel distance. • Fine particulates are dominant in most regional-scale aerosol pollution events. + Emissions + washout Penn State Earth and Mineral Sciences www.ems.psu.edu/~lno/Meteo437
The evolution and unified chemistry of regionalacids, ozone, particulate matter, and mercury. Gases: blue Particulates: green HO•, HO2•: red
Twenty four-hour averaged PM2.5 concentration on July 17, 2010 Sensitivity to a 50% reduction in SO2 emissions from Tennessee An average of 75% of PM2.5 in each state is found to be sensitive to SO2 emissions from other states. (Bergin et al., In progress)
Particulate Matter Anthro. Sources • In industrialized areas (e.g. Europe, N. Amer., Japan, large cities in Asia) particles are mainly generated by gasoline, diesel, and coal combustion and from condensed organic and metal vapors, and tend to contain sulfate, nitrate, ammonium, and organic carbon, with smaller amounts of metals and crustal materials. • In less developed areas, (e.g. parts of Africa and Asia) biomass burning is the principal source of regional aerosol pollution, resulting largely in elemental and organic carbon particles and nitrate. • Dust storms largely contribute mineral particles, and are exacerbated by desertification. M. Bergin GA Instit. of Technol.
A satellite image from the Earth Probe TOMS. NASA. (EPA 2002) Smoke/Dust (absorbing aerosols) from forest fires in Central America and Southern Mexico over North America on May 15, 1998. Visibility in many Texas cities was less than 1 mi. Dust and burning plumes may also carry anthropgenic aerosols. One study estimates transboundary transport of particulate matter and its precursors dominated natural sources in the US, and that up to 30% of the transboundary particulate matter was due to transport from Asia. (Park et al., J. Geophys. Res., 2004)
Mercury “… Mounting evidence strongly implicates mercury exposure as playing a role in the increasing rates of learning disabilities found today in our children. … the EPA reported that 1 in every 6 women of child bearing age had mercury levels high enough to cause adverse neurodevelopmental outcomes in their unborn children. … boys are more sensitive to the neurological effects of mercury than are girls …” Letter printed in Newsweek Feb 13, 2006Lyn Redwood, PresidentRobert J. Krakow, Board of DirectorsSensible Action for ending Mercury-Induced Neurological Disorders (SafeMinds) M. Bergin GA Instit. of Technol.
Mercury • Mercury affects the immune system, alters genetic and enzyme systems, and damages the nervous system. Developing embryos are five to ten times more sensitive to damage by MeHg, which rapidly crosses the placenta, than are adults, and young children are especially susceptible to mercury’s neurotoxic effects. • In the US alone, over 60,000 children per year are estimated to be born at risk for adverse neurodevelopmental effects caused by in utero exposure to MeHg. • In the US, 2003, 45 states issued mercury advisories to limit the consumption of certain fish from freshwater lakes and rivers, coastal waters, and marine environments. (NRDC (Jan 2006) estimates 1 can of tuna a month for a child of 45 lbs.) • Humans are exposed to MeHg almost entirely by eating contaminated fish and animals that are at the top of aquatic food chains. M. Bergin GA Instit. of Technol.
Estimated global emissions of mercury. UN Eviron. Programme (UNEP) 2003. • About 75% of the total 1995 anthro. emissions are attributed to combustion of fossil fuels (Pacyna ,2003) particularly in coal-fired power plants (NRC, 2000; EPA, 2004).Asian countries are estimated to contribute over 50% of the total emissions chiefly from coal combustion in China, India, and South and North Korea.
Estimates of Annual Mercury Contributions to the Atmosphere (Mg/yr) Values from Seigneur et al., Environ. Sci. Technol. 2004 Approximately 1/3 are natural and 2/3 are anthropogenic (US EPA, 2004) M. Bergin GA Instit. of Technol.
Conceptual biogeochemical mercury cycle a (Environ. Can. 2004)
Lifetime of Mercury in the Atm. • Lifetime of elemental mercury Hg0→ 1.2–1.5 yearsNew findings strongly indicate 1 or 2 months. (Renner R., Environ. Sci. Technol., 2004) • This more rapid oxidation may be due to reactions with halides (at the poles and temperate marine boundary layer) and urban pollutants, most likely ozone. • This shorter lifetime suggests that deposition occurs much more rapidly than previously estimated, and therefore current emissions are likely higher than estimated. One such underreported source may be gold mining activities, which may release between 800 and 1000 Mg/yr (previous estimates are 300 Mg/year) (UN Eviron. Programme (UNEP) 2003) M. Bergin GA Instit. of Technol.
Persistent Organic Pollutants • Toxic organic substances that widely disperse, persist in the environment, bioaccumulate, and pose a risk to human health and the environment. • Common characteristics • Semivolatile and/or partial water solubility • Transported in the atmosphere both in the gaseous and condensed phases, deposited, and then reemitted through a repeated (and often seasonal) cycle of evaporation and deposition • Lifetimes from a few years to decades long • Most commonly recognized are partially oxidized and/or halogenated organics, often including one or more aromatic structures. • Linked to causing, among other effects, cancer, damage to the nervous system, reproductive disorders, behavioral disorders, and disruption of the immune and endocrine systems (includes allergies, asthma, thyroid disorders, and others.) M. Bergin GA Instit. of Technol.
POPs: human health effects • POPs enter humans chiefly through animal-derived food (fish, poultry, beef, eggs, and dairy products). Concentrations can magnify in fatty tissues by up to 70,000 times background levels. • Because of their fat-seeking properties, POPs magnify in infants both in utero and through breast-feeding, magnifying concentrations through generations. • Human breast milk concentrations of some monitored POPs have been increasing exponentially, serving as an indicator of past human exposures and environmental conditions. Previously unrecognized POPs (i.e., brominated biphenyl ethers) have been identified by increasing concentrations found by systematic monitoring of chemicals in human breast milk in Sweden after they banned the use of seven other POPs in the 1970s. M. Bergin GA Instit. of Technol.
Modeled BaP (a PAH) depositions from national sources of France in 2001, g/km2/y. MSC-E (EMEP/LRTAP), 2004. unit: g/km2/y max: 743 • POPs released in one part of the world may circulate regionally and globally via the atmosphere, oceans, and other pathways. • Regional transport and deposition of POPs (and heavy metals) in Europe have been demonstrated through modeling. Further evidence of long-range transport comes primarily from the detection of POPs in remote locations. In the colder environments at the poles, semivolatile POPs condense and accumulate. Atmospheric monitoring data are sparse, and global emission distributions are poorly characterized.
POPs Legislation • “The Dirty Dozen” • DDT, aldrin, dieldrin, endrin, chlordane, heptachlor, mirex, toxaphene, hexachlorobenzene (HCB), polychlorinated biphenyls (PCBs), dioxins, and furans. • pesticides (e.g., DDT, aldrin, dieldrin, endrin) • consumer or industrial applications, such as coolants, flame retardants, lubricants, and sealants (e.g., PCBs) • generated unintentionally as by-products of various combustion processes, such as medical waste incineration (e.g., polycyclic aromatic hydrocarbons (PAHs), dioxins, and furans). • Targeted to be banned or restricted by the Stockholm Convention on POPs, signed in May 2001 by over 100 countries (except for DDT in some places) • All 12 have been identified in Great Lakes’ fish and wildlife, even though some of these compounds were never used in significant quantities in the region. Consumers of the regions’ fish have up to eight times the body burden of POPs as the general public. M. Bergin GA Instit. of Technol.
POPs Legislation (cont.) REACH — Regulation, Evaluation, and Authorization of Chemicals • Since 1998, Europeans have been working on legislation that will require industry to prove that chemicals being sold and produced in the EU are safe to use or handle. The current system requires governments to prove that a chemical is dangerous. The policy will require registration of all substances that are produced or imported into the EU in quantities greater than 1 ton. • “European government officials charged that U.S. government agencies have worked closely with business to weaken the impact of REACH … According to documents … released by U.S. Rep. Henry Waxman (D-CA), U.S. government lobbying on behalf of industry … provided “talking points” for U.S. government officials … notably similar in language to themes developed by industry at the request of a U.S. trade official …“The United States has not conducted studies on the health and environmental impacts of REACH,” Waxman tells ES&T. “It [simply] began to lobby against REACH on behalf of U.S. industry interests without a full understanding of these impacts.” …ES&T Online News (Feb 1, 2006) M. Bergin GA Instit. of Technol.
Regional Climate Change • Particulate matter • Fine particles scatter light efficiently, resulting in a cooling effect on ambient temperature. • Black carbon particles absorb light and create a warming effect. • These aerosols have different spatial distributions, so do not simply offset each other. • Particles also serve as cloud nuclei, increasing the number of cloud droplets but decreasing average cloud droplet size and pattern of rainfall. • These properties can alter regional atmospheric stability and vertical motions, impact large-scale circulation, and alter the hydrologic cycle. The impact of aerosols depends on chemical and physical properties of the particles that are not yet well characterized. M. Bergin GA Instit. of Technol.
Regional Climate Change (2) • Ozone • Tropospheric O3 ranks only behind CO2 and CH3 in anthropogenic contributions to global average radiative forcing and is expected to increase the global average temperature over the next decades. • Urban ozone is expected to increase with increases in temperature, particularly during highly polluted episodes. • Natural climate patterns impact air pollution formation and transport, and evidence strongly indicates that air pollution also impacts climate.Political bodies must address questions such as whether to act under the current understandings and uncertainties, and if so, how to coordinate or prioritize mitigation efforts and who is responsible for reducing emissions.Scientific bodies must aid in unifying our understanding of air pollution and its impacts and identifying efficient control strategies. RGGI: A Regional Greenhouse Gas Initiative MOU was signed on December 20, 2005 by the Governors of Connecticut, Delaware, Maine, New Hampshire, New Jersey, New York, and Vermont. This program designs a ‘cap and trade’ program for carbon emissions. M. Bergin GA Instit. of Technol.
A Unified View The evolution and unified chemistry of regional acids, ozone, particulate matter, and mercury. Each pollutant has distinct regional characteristics, yet they are intimately linked by the chemistry and physics of the atmosphere, as well as by common sources and possible controls. Gases: blue PM: green HO•, HO2•: red Their linked chemistry and common sources present strong arguments for addressing them simultaneously to identify the most effective control policies. M. Bergin GA Instit. of Technol.
MANAGEMENT OF REGIONAL TRANSBOUNDARY AIR POLLUTION Generally, decreasing upwind emissions requires the development of some type of cooperative regime -“social institutions consisting of agreed-upon principles, norms, rules, procedures, and programs that govern the interactions of actors in specific issue areas”A regime encompasses a whole process of interaction, including both scientific and political activities, with or without formal agreements. M. Bergin GA Instit. of Technol.
Achieving Successful Regimes for Addressing Transboundary Air Pollution • The amount of human resources or money is not the deciding factor in reaching an agreement, but the “generation of the coordination, cooperation, and trust”. • Generally follows two phases: • Frame the problem — define the issues, knowledge, and relationships between the parties, and the interests and positions of parties, as well as the differences in positions. Cooperative scientific research plays a leading role. Agreements reached are typically general. • Build on the institutions created in the first phase, allowing for the increasingly complex and substantive policy agreements. During this phase, emphasis is placed less on the international dimensions of the problem, and more on analysis of collectively beneficial, efficient alternatives. M. Bergin GA Instit. of Technol.
Examples of transboundary air quality management regimes and approaches Emission Trading of SO2 for Acid Deposition Control (US) • Part of 1990 U.S. Clean Air Act Amendments (CAAA) and the Acid Rain Program. • Designed a market with a fixed number of emission allowances that could be bought, sold, or traded. • Goal to cut SO2 emissions from power plants to half of 1980 levels by 2010. • By 2003, achieved a 38% reduction from 1980 levels. • Initial estimates of the cost of reductions were $4 to $8 billion per year. • Recent estimates are that the costs have been about $1 billion per year. M. Bergin GA Instit. of Technol.
Examples continued Regional NOx Control for Ozone (US) • The Ozone Transport Commission (OTC) was formed in the 1990 CAAA to consist of 12 east coast states (Maine to Virginia) • Most states were both upwind and downwind of nonattainment areas. • Designed an emission trading program similar to that of the SO2 program. • Succeeded because states were mutually assured that all states would be subject to similar controls and overall costs of emission reductions would be reduced through trading. • The Ozone Transport Assessment Group (OTAG) was created in 1995 to address regional ozone. It was comprised primarily of representatives of the EPA and 37 states in the eastern half of the United States. • The differences between conditions in upwind and downwind states and the lack of political leverage to encourage upwind states to reduce emissions were not overcome, and OTAG was able only to reach a weak consensus. • Only through the intervening authority of a higher governmental body (the US EPA) could a regional strategy be implemented. M. Bergin GA Instit. of Technol.
Examples continued Cooperative Control in Europe • The 1979 Long-Range Transboundary Air Pollution (LRTAP) Convention • Includes all of the nations of Europe (including the former Soviet Bloc), the US, and Canada. • Eight protocols have been successfully negotiated, including agreements to support scientific cooperation and obligations to reduce emissions related to acidification, tropospheric ozone, POPs, heavy metals, and eutrophication. • Recently expanded to include several of the former Soviet republics in Central Asia. M. Bergin GA Instit. of Technol.
Important Characteristics of Past Successful Regimes • Cooperation among technical experts. • Developed scientific cooperation before political negotiations began. • Provided support to build technical and management capacity of all parties for timely analyses of proposals. Such analyses are most effective when considered to be • credible (competent and appropriate for decision needs) • legitimate (the assessment process is transparent and impartial) • salient (relevant and timely for decision-making needs). • Tend to have few parties, parties are economically, culturally, or geographically similar. However, regimes are unlikely to succeed unless they involve all major parties contributing to a problem. • Developed interpersonal trust between key actors and with institutions. • Ensured the accountability of parties in fulfilling commitments. • Are adaptable to changing situations and information. M. Bergin GA Instit. of Technol.
Acknowledgments • EPA STAR graduate fellowship • EPA STAR research grants • NASA New Investigator Program grant to D. Mauzerall • National Oceanic and Atmospheric Administration, U.S. Department of Commerce. • The Annual Review of Environment and Resources is online at http://environ.annualreviews.org M. Bergin GA Instit. of Technol.