Download
1 / 47
530 likes | 1.11k Views
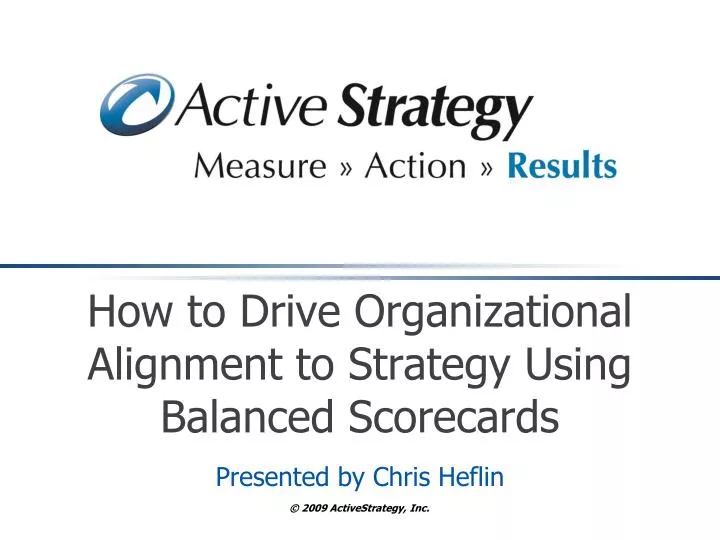
How to Drive Organizational Alignment to Strategy Using Balanced Scorecards. Presented by Chris Heflin. Presentation Overview. Strategic vs. Operational Goals Setting Strategic Goals Creating a Balanced Scorecard Deploying Scorecards to Execute Goals

E N D
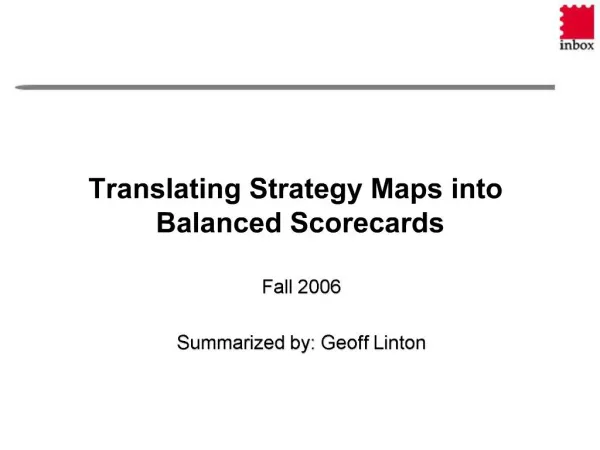
How to Drive Organizational Alignment to Strategy Using Balanced Scorecards Presented by Chris Heflin
Presentation Overview • Strategic vs. Operational Goals • Setting Strategic Goals • Creating a Balanced Scorecard • Deploying Scorecards to Execute Goals • Aligning & Prioritizing Improvement Initiatives • Linking Strategy to Action Plans via Scorecards • Best Practices • Tying this back to WSQA Criteria
Strategic vs. Operational Goals Manager Director Executive Supervisor Amount of time spent on strategic efforts (typical)* Increased time spent on strategic efforts (ideal) Operational (Including operational measures & incremental improvement plans) * Includes critical few objectives & measures that need to be improved plus key strategic improvement initiatives
Defining Strategic Goals Strategic Goals have the following components: • Perspectives –high-level focus areas • Objectives – verb-noun statements that reflect the strategic plan (e.g., “Improve Customer Satisfaction”) • Measures/Metrics - #, $, or % that indicates performance against an objective • Targets – what the measure should attain • Initiatives – improvement projects (e.g., “Improve Cycle Time”)
Making Strategic Goals Actionable SWOT Analysis Key Strengths, Weaknesses, Opportunities & Threats Strategic Goals Top-Level Balanced Scorecard Strategy Map Prioritized Initiatives Visual simplification of Strategic Plan Aligned improvement Operational framework to communicate, deploy and execute plan
Create a Strategy Map What is a Strategy Map? • Visual simplification of strategic objectives • Shows cause and effect relationships • Helps ensure you’re not missing any key drivers
Steps to Creating a Strategy Map • Prioritize SWOT outputs & convert to “verb noun” strategic objectives • Group objectives by “perspective” or high-level focus area • Identify cause-and-effect relationships with arrows
The Anatomy of a Strategy Map High-level “objectives” (verb/noun) Perspectives Traditional Scorecard “Perspectives” Links showing relationships
Example Strategy Map for Public Sector Note: Perspective names and their cause & effect order change
Creating a Balanced ScorecardStep 1:Transfer from Strategy Map • Transfer Perspectives and add Index numbers (1.0, 2.0) • Retain cause & effect hierarchy • Transfer Objectives into proper Perspective and add Index numbers (1.1, 2.1)
Keep in Mind • Can use more or different perspectives (if appropriate), BUT BALANCE IS CRITICAL • Objectives must contain a verb (grow sales, reduce complaints, etc.) • Keep objectives focused (7-12 max per scorecard)
Perspectives & Objectives on BSC Perspective Objective Index Number
Creating the Top-Level BSCStep 2:Determine Measures • Should represent the best indication that an objective is being met • Ask what outcomes your stakeholders desire from the objective: • Quality or defects • Revenues • Cost or productivity • Responsiveness or Cycle Time • Employee or Environmental Safety
Creating the Top-Level BSCStep 2:Determine Measures • Keep to 1-3 measures per objective • One objective may be measured with two or three dissimilar units of measures, e.g.Customer Satisfaction may be measured by: • Survey Results (Very Good) • Number of Complaints (4 per quarter) • Turnaround time (2 days)
Lagging Measures • Lagging measuresare reported infrequently, too late to prevent a problem • Examples are a company’s critical high-level outcome measures: • Sales • Service Quality • Expenses • Customer Satisfaction
Breaking Down a Lagging Measure • First Step – Dimensional Measures • These break down a measure by its component parts using the same units (e.g. Sales by Division or Geography) • Note: dimensional measures alone do not get at the root causes of a problem
Leading Measures • Leading Measures • break down an important measure into what drives it (e.g. # of quotes or size of pipeline) • Also called Cause & Effect or Process Measures
Leading Measure Examples • Examples: • Customer Satisfaction leads Revenues • Service Response Time leads Customer Satisfaction • % Service Rep Availability leads Service Response Time • Leading/Lagging are relative terms • A leading measure in one area is likely a lagging measure to another area
Creating the Top-Level BSCStep 3:Align & Prioritize Initiatives • Initiatives are time-bound projects • They have defined resources • Also called Projects, Action Plans • Some are derived from the SWOT Analysis • They should be prioritized based upon: • alignment to an identified performance gap in a strategic area • size of the performance gap • resources required to improve • ROI, etc.
Prioritize and Align Initiatives • Align current initiatives (time-bound improvement projects) to measures • Cease initiatives that do not align and any that align to measures that are meeting goals • Consider new initiatives to address underperforming measures • Aligned initiatives drive results by addressing root causes
Great, the BSC is Finished! • Well…actually, this is just the beginning • The next step is to create a “cascaded” framework of scorecards • Create linked scorecards down & across the organization • This is where you really start to deploy your strategy and make it actionable
What It Looks Like (Long-Term) Top-Level Scorecard Divisional or Business Unit Scorecards Department or Functional Scorecards Individual Employee Goals
Why is Cascading Scorecards Critical? • It results in a proactiveperformance system • it communicates and translates the strategy to all levels • when a critical top-level lagging measure is underperforming, lower level causes can be easily identified • allows you to fix important problems before they become high-level issues
How to Cascade – an Overview • Create linked, related (but not identical) scorecards for next organizational level • As you go, translate objectives to make them meaningful to that area • e.g., “Improve Customer Satisfaction” might become “Reduce Wait Times for Customers” • Align measures to the translated objectives • e.g., % of Customers waiting more than 5 minutes
Cascading Objectives & Measures Using a Process Matrix Approach
Tips on Using a Process Matrix Approach • Used to align business processes to strategic objectives • Helps to identify their translated objectives & leading measures • Works best for functional and support areas • Process owners must be involved
Create a Matrix for Each Area Outcome IT’s Business Processes p. 32
Identify Outcomes & Intersections Outcomes Availability IT’s Business Processes Data Ctr. Rev. Cust. Sat. Resolved calls p. 33
Translate the Objectives Outcomes Availability Data Ctr. Rev. Cust. Sat. IT’s Core Processes Resolved calls p. 34
Align Measures Using the Matrix IT’s Core Processes p. 35
Place On Appropriate Scorecard • Place objectives & related measures on the appropriate scorecard • Assign an owner to each to ensure accountability • Finally, establish goals for each measure to track progress • Cascaded objectives & measures create alignment to top-level strategy
Going From Strategy to Action Plan An Example “Drill Down” from the City of Coral Springs Scorecards
Police Scorecard Click to drill down
Drill down reveals Measure Details Contributing lower-level measures Aligned improvement Initiatives
Additional Measure Details (trend charts & graphs, comparisons)
Initiative Detail Click to see commentary from Initiative Owner about the initiative and Action Plans
Best Practices to Remember • Start with your strategy • Keep objectives to the critical few • Pick measures you can actually measure – and those that drive the right behaviors • Cascade & deploy (scorecards are NEVER perfect, so don’t wait) • Review performance of scorecards regularly
How Does This Fit Into the WASQ Criteria? • What WASQ categories does this type of framework address? • Why?
“How to Drive Organizational Alignment to Strategy Using Balanced Scorecards” Presented by Chris Heflin cheflin@activestrategy.com Please stop by the ActiveStrategy tableto learn more or visit www.activestrategy.com Thank You for Participating