Download
1 / 16
170 likes | 269 Views
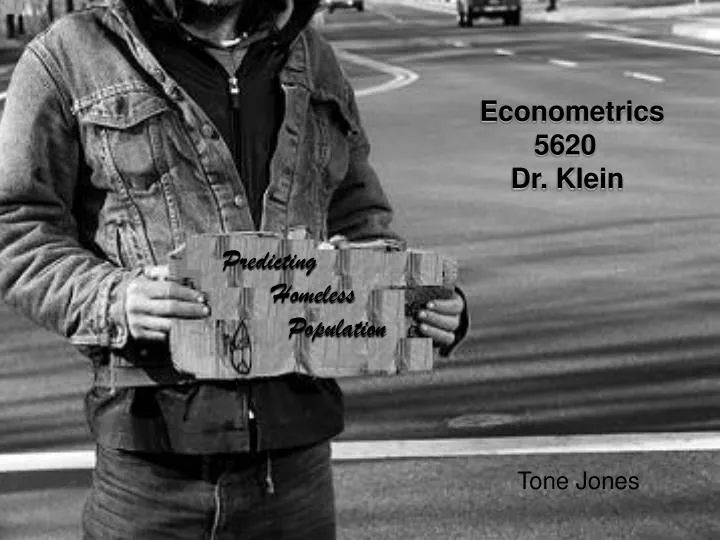
Econometrics 5620 Dr. Klein. Predicting Homeless Population. Tone Jones. Research Question & Testing Method.

E N D
Econometrics 5620 Dr. Klein Predicting Homeless Population Tone Jones
Research Question & Testing Method Is there a relationship between Homeless Population and x values(hours of traffic delay, Ave. snowfall (in), unemployment rates median income, and population)? Data Analysis using a Regression R^2 T-Value F-Value Level of Significance
Major Cities & Homeless Count MA 1Baltimore2,904MI 2Detroit 14,827 NV3LasVegas 12,198NY4New York 48,155 PA5Philadelphia 6,6536Memphis 1,876 7Nashville1,542WA8seattle 8,336 9Milwaukee 2,818TX10San Antonio1,651 11Columbus 1,869CA12Los Angeles 91,000 AZ13Phoenix1,906CA14Pasadena1,217 CA15San Francisco 6,248CA16San Jose 4,910TX17Houston12,005CO18Denver 10,268 DC19Washington5,518FL20Jacksonville2,930 21Miami5,16022St. Louis477CA23Sacramento 2,22924Atlanta 6,832 IL25Chicago 6,715NM26Albuquerque 3,649IN 27Indianapolis 2,287MA28Boston 5,819MN29Minneapolis3,415TX30El Paso 1,415 31Austin1,892 Mean = 8,711 http://www.weingart.org/institute. Institute for the Study of Homelessness and Poverty
Population Count Baltimore Detroit Las Vegas New York Philadelphia Memphis Nashville Seattle Milwaukee San Antonio Columbus Los Angeles Phoenix Pasadena San Francisco San Jose 636,251 900,198 1,650,671 8,104,079 1,470,151 671,929 546,719 1,777,143 583,624 1,493,965 1,088,971 9,937,7391,418,041 144,068 744,230 904,522 Houston(Har)Metro-Denver WashingtonJacksonvilleMiami St. LouisSacramento Atlanta Chicago Albuquerque Indianapolis Boston Minneapolis El Paso Austin 3,644,285 2,555,636 553,523 985,732 2,363,600 1,009,235 1,352,445 1,490,163 2,862,244 593,765 784,242 569,165 1,120,897 592,099 869,868 Mean =1,723,200 Institute for the Study of Homelessness and Poverty at the Weingart Center http://www.weingart.org/institute
Median Income Baltimore Detroit Las Vegas New York Philadelphia Memphis Nashville- DV Seattle Milwaukee San Antonio Columbus Los Angeles Phoenix Pasadena San Francisco San Jose 32,337 30,461 44,593 39,285 31,340 30,729 38,978 46,541 32,447 36,706 37,540 39,139 42,721 47,152 58,621 76,181 Houston Metro-Denver WashingtonJacksonvilleMiami St. LouisSacramento Atlanta Chicago Albuquerque Indianapolis Boston Minneapolis El Paso Austin 37,355 37,010 43,681 40,366 20,883 26,324 44,446 35,280 38,803 40,852 41,278 39,819 35,708 30,946 45,785 Mean = $39,462 Median income is the amount which divides the income distribution into two equal groups, half having income above that amount, and half having income below that amount. http://www.census.gov/acs/wwwproducts/Rankin/2002 R0t60.html
Annual Traffic Delay Per Person Baltimore Detroit Las Vegas New York Philadelphia Memphis Nashville Seattle Milwaukee San Antonio Columbus Los Angeles Phoenix Pasadena San Francisco San Jose 50 55 38 73 42 34 44 82 32 43 36 136 59 24 92 74 Houston Denver Washington Jacksonville Miami St. Louis Sacramento Atlanta Chicago Albuquerque Indianapolis Boston Minneapolis El Paso Austin 75 67 84 32 69 43 42 70 67 45 43 67 54 24 61 Mean = 56.7 www.infoplease.com/ipa/A0855647.
Average snowfall (in) Houston Denver Washington Jacksonville Miami St. Louis Sacramento Atlanta Chicago Albuquerque Indianapolis Boston Minneapolis El Paso Austin 0.4 60.3 17.1 0 0 19.6 0 0.4 38 11 23.9 42.8 49.9 5.3 0.9 Baltimore Detroit Las Vegas New York Philadelphia Memphis Nashville Seattle Milwaukee San Antonio Columbus Los Angeles Phoenix Pasadena San Francisco San Jose 21.5 41.3 1.2 28.6 20.8 5.1 10.1 11.4 47 0.7 28.2 0 0 0 0 0 www.infoplease.com/ipa/a0762183html
Unemployment Rates Houston Denver Washington Jacksonville Miami St. Louis Sacramento Atlanta Chicago Albuquerque Indianapolis Boston Minneapolis El Paso Austin 4.2% 4.4% 3% 4.3% 4.1% 5.4% 5.9% 4.4% 4.9% 3.1% 3.9% 3.7% 4.5% 5.6% 3.6 % Baltimore Detroit Las Vegas New York Philadelphia Memphis Nashville Seattle Milwaukee San Antonio Columbus Los Angeles Phoenix Pasadena San Francisco San Jose 3.6 % 8% 5.6% 4.4% 4.1% 5.5% 4.2% 4% 4.7% 4% 4.9% 5% 3.9% 4.8% 4.7% 5.1% National Unemployment Rate = 5.1% http://www.bls.gov/web/laummtrk.htm
Heteroscedasticity ? 712.65 3660.8 7583.23 -4073.03 4627.12 -2097.98 -1211.93 1513.98 549.42 -311.827 -933.72 2562.02 -1711.85 -985.84 -2954.36 -2837.80 122.74 2958.74 387.358 1744.01 -1327.05 - 4148.59 -3257.884 899.38 -2472.06 2979.06 469.44 1349.42 -729.89 2191.34 11166.16 4614.763 52228.03 2025.879 3973.989 2753.936 6822.013 2268.574 1962.827 2802.721 88437.97 3617.851 2202.846 9202.368 7747.804 11882.25 7309.254 5130.641 1185.980 6487.052 4625.597 5486.884 5932.615 9187.065 669.9313 1817.550 4469.576 4144.898 Y- value residuals X- value predicted Chapter 12 Hmw
Heteroscedasticity ? 13.13798854 16.4108947 17.86738979 16.62428742 16.87938023 15.29746941 14.19994896 14.64500267 12.61774617 11.48490218 13.67835621 15.6971029 14.89066134 13.78700109 15.98208035 15.90157169 9.620246083 15.98504124 11.91870107 14.92789573 14.38143055 16.66105128 16.17766661 13.60342121 15.6256188 15.99873202 12.30312146 14.41486552 13.18581078 7.692272 9.320643 8.437017 10.86337 7.613759 8.287526 7.920786 8.82791 7.726907 7.582141 7.938346 11.39006 8.193636 7.697506 9.127216 8.955165 9.382801 8.896897 8.542986 7.078325 8.777563 8.439361 8.610116 8.68822 9.125552 6.507175 7.505245 8.405049 8.329634 Y- value Ln of res^2 X- value Ln predicted Chapter 12 Hmw
Heteroscedasticity ? HMW Ch. 12
Conclusion There is a relationship between Homeless Population and (hours of traffic delay, unemployment rates, and population) There is not a significant relationship between Homeless Population and (average snowfall / Median Income) Houston (predicted) -9699.865887 + 9.59054E-10(13,280,813,161,225 ) + -0.00225531(3,644,285 ) +118.1913508(75 ) +1952.319198 (4.2 ) = 11882.25328Actual = 12,005 Areas for further research Income from tourists Shelters present
THE END