Download
1 / 25
250 likes | 388 Views
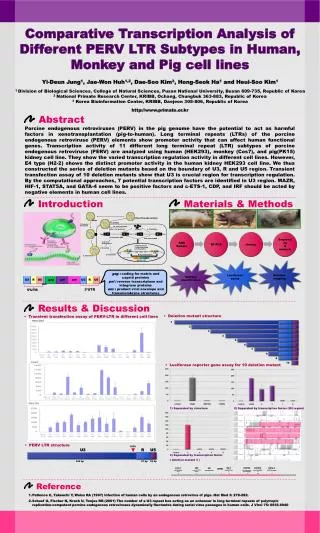
Comparative transcriptomic analysis of fungi. Group Nicotiana Daan van Vliet, Dou Hu, Joost de Jong, Krista Kokki. Research objective. To study differences in gene expression in related fungus species Studies species: Reference genome RNA reads > 100 bp Preferably: Paired-end

E N D
Comparative transcriptomic analysis of fungi Group Nicotiana Daan van Vliet, Dou Hu, Joost de Jong, Krista Kokki
Research objective To study differences in gene expression in related fungus species Studies species: Reference genome RNA reads > 100 bp Preferably: Paired-end Related species Similar conditions
Comparison Comparison between different species - Saccharomyces cerevisiae (yeast) - Komogataellapastoris (Pichia, yeast) - Aspergillusoryzae(fungus)
Methods – Data [Daan] RNA-seq: SRA Genome and annotation: Ensembl Fungi Read quality analysis performed with FastQC
Methods - Data processing Cleaning reads: SolexaQA Mapping reads: TopHat Assembly/Quantification: Cufflinks Optional replicate assembly: Cuffmerge Extracting transcript seqs: gffread Selection of top 100 genes: Linux
Methods – Interaction Top 100 genes were mapped to the interactome file and visualised through Cytoscape.
Hypothesis for yeast - Validation GC-content correlates positively with gene length. Negative correlation with gene length and degree of codon bias. Codon bias is more extreme in highly expressed genes. Genes with longer introns show higher bias in codon usage. The overall codon usage matches the known bias.
GO-terms and gene locations The top 5 most over-represented GO-terms for all the found genes The chromosomes the genes are found in.
Results – Correlations Saccharomyces cerevisiaeAspergillusoryzaeKomogataellapastoris Gene expression vs. Gene length
Results – Correlations Saccharomyces cerevisiaeAspergillusoryzaeKomogataellapastoris Gene expression vs. Intron length
Results – Correlations Saccharomyces cerevisiaeAspergillusoryzaeKomogataellapastoris Gene expression vs. Effective Nr of codons
Results – Correlations Saccharomyces cerevisiaeAspergillusoryzaeKomogataellapastoris Effective Nr of Codons vs. GC-cont. 3rd pos.
Results – Correlations Saccharomyces cerevisiaeAspergillusoryzaeKomogataellapastoris Gene length vs. Effective Nr of Codons
Results – Correlations Saccharomyces cerevisiaeAspergillusoryzaeKomogataellapastoris Gene length vs. GC-content
Results – Correlations Saccharomyces cerevisiaeAspergillusoryzaeKomogataellapastoris Gene length vs. Intron length
Results – Correlations Saccharomyces cerevisiaeAspergillusoryzaeKomogataellapastoris Intron length vs. Nc
Results – Correlations Overall: Within species:Few correlations between gene properties Between species:Different patterns(?)
Cytoscape • GO terms Top100 genes show different interactive network in GO terms
Results - First choice Yeast Interactome Project for S. cerevisiae • high-throughput yeast two-hybrid (Y2H) provides high-quality binary interaction information. • high-throughput Y2H dataset covering ~20% of all yeast binary interactions. • This binary map is enriched for transient signalling interactions and inter-complex connections with a highly significant clustering between essential proteins.
Database choosing • interactions from CCSB-YI1 1,809 interactions among 1,278 proteins
Second choice YeastNet v. 2 • a probabilistic functional gene network of yeast genes, constructed from ~1.8 million expermental observations from DNA microarrays, physical protein interactions, genetic interactions, literature, and comparative genomics methods. • In total, YeastNet v.2 covers 102,803 linkages among 5,483 yeast proteins • a modified Bayesian integration of diverse data types, with each data type weighted according to how well it links genes that are known to share functions. (LLS)
Database choosing • All the top 100 genes could find interactors in the Yeastnet v.2. • We could find 9896 possibilities among 102,803 linkages
The end Questions?
Results – Correlations Saccharomyces cerevisiaeAspergillusoryzaeKomogataellapastoris Gene expression vs. CG content