Download
1 / 12
120 likes | 366 Views
Inventory Models. Production Lot Size Models. PRODUCTION LOT SIZE MODELS. In a production lot size model, we are a manufacturer, trying to determine how much to produce (the production lot size) during each production run. Like the EOQ model with Q = the production lot size except:

E N D
Inventory Models Production Lot Size Models
PRODUCTION LOT SIZE MODELS • In a production lot size model, we are a manufacturer, trying to determine how much to produce (the production lot size) during each production run. • Like the EOQ model with Q = the production lot size except: • We are producing at a rate P/yr. that is greater than the demand rate of D/yr. • Otherwise run process continuously and sell items as fast as they are produced • Inventory does not “jump” to Q but builds up to a value IMAX that is reached when production is ceased
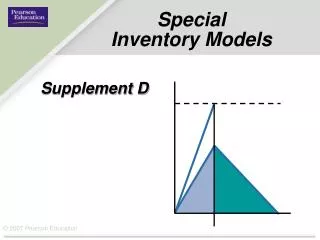
What is the maximum inventory and the average inventory per cycle? • Length of a production run = Q/P • During a production run • Amount Produced = Q • Amount Demanded = D(Q/P) • IMAX = Q - D(Q/P) = (1-D/P)Q • Average inventory = IMAX/2 = ((1-D/P)/2)Q
PRODUCTION LOT SIZE -- TOTAL ANNUAL COST • Q = The production lot size • CO = Set-up cost rather than order cost =$/setup • Number of Set-ups per year = D/Q • Average Inventory = ((1-D/P)/2)Q • Instantaneous set-up time/infinite time horizon TC(Q) = CO(D/Q) + Ch((1-D/P)/2)Q + CD
OPTIMAL PRODUCTION LOT SIZE, Q* TC(Q) = CO(D/Q) + Ch((1-D/P)/2)Q + CD
EXAMPLE-- Farah Cosmetics • Production Capacity 1000 tubes/hr. • Daily Demand 1680 tubes • Production cost $0.50/tube (C = 0.50) • Set-up cost $150 per set-up (CO = 150) • Holding Cost rate: 40% (Ch = .4(.50) = .20) • Since demand is 1680 per day and the production rate is 1000 per hour: • D = 1680(365) = 613,200 • P = 1000(24)(365) = 8,760,000
TOTAL ANNUAL COST TOTAL ANNUAL COST = TC(Q) = TV(Q) + CD TV(Q) = CO(D/Q) + Ch((1-D/P)/2)Q = (150)(613,200/31,449) + .2((1-(613,200/8,760,000))(31,449)/2) = $5,850 TC(Q) = TV(Q) + CD = 5,850 + .50(613,200) = $312,450
OTHER QUANTITES • Length of a Production run = Q*/P = 31,449/8,760,000 = .00359yrs. = .00359(365) = 1.31 days • Length of a Production cycle = Q*/D = 31,449/613,200 = .0512866yrs. = .00512866(365) = 18.72 days • # of Production runs/yr. = D/Q* = 19.5 • IMAX = (1-(613,200/8,760,000))(31,449) = 29,248
REORDER (SETUP) POINT ANALYSIS • The reorder point (actually the setup point) and safety stock determination are not affected by the calculation of Q*. • It is found in the same way as before: • r* = LD + SS if demand is constant over lead time • r* is found using service levels if demand varies during lead time
Using the Template Optimal Values Enter Parameters Production Lot Size Worksheet
Review • Production Lot Size Models find the amount to produce per production run • P > D, else optimal solution is to run machine continuously • Same as EOQ exceptIMAX= Q(1-D/P) • Length of a production run = Q*/P • Length of the production cycle = Q*/D • Reorder (setup) point analysis is not affected. • Use of template