Download
1 / 30
300 likes | 397 Views
In Excel 2 we saw that the brains of French Women are significantly smaller (*) than their male counterparts. *. *. It may just be because Females are smaller than Males and therefore we should standardise our data to correct for the difference in Body size.

E N D
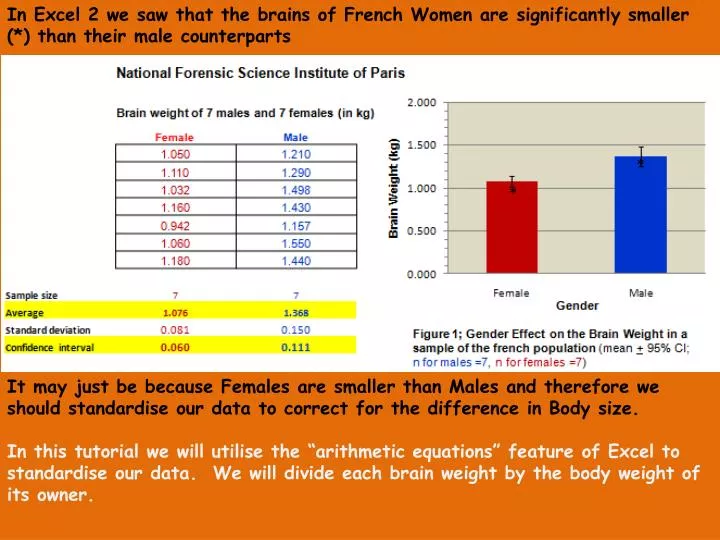
In Excel 2we saw that the brains of French Women are significantly smaller (*) than their male counterparts * * It may just be because Females are smaller than Males and therefore we should standardise our data to correct for the difference in Body size. In this tutorial we will utilise the “arithmetic equations” feature of Excel to standardise our data. We will divide each brain weight by the body weight of its owner.
EXCEL’S ARITHMETIC EQUATIONS In Excel 2we saw that the brains of French Women are significantly smaller (*) than their male counterparts * * It may just be because Females are smaller than Males and therefore we should standardise our data to correct for the difference in Body size. In this tutorial we will utilise the “arithmetic equations” feature of Excel to standardise our data. We will divide each brain weight by the body weight of its owner.
Arithmetic Equations BASIC KNOWLEDGE I will assume that you possess basic knowledge of Excel (see Tutorials 1&2) In this tutorial you will learn how to go from THIS
3- To Learn how to use Arithmetic Equations Insert an extra column Wrap text inside a cell THAT Learn how to make 2 graphs in less than 30 sec.
Arithmetic Equations I will assume that you possess basic knowledge of Excel (see Tutorials 1&2) In this tutorial you will learn how to go from THIS to Click on the arrow!
Arithmetic Equations THAT Learn how to insert an extra column Learn how to wrap text inside a cell Learn how to use Arithmetic Equations Learn how to make 2 graphs in less than 30 sec.
FIRST – SOME BACKGROUND INFORMATION ON ARITHMETIC EQUATIONS IN EXCEL! 4-
Excel can do Arithmetic Equations and this is the list of Arithmetic operators it uses. IMPORTANT: The sign = tells Excel that the succeeding characters constitute a formula. Excel can also use parentheses () to control the order of calculation. Excel can perform calculations on numbers or on cells (we will see how to perform calculations on cells next).
Wait a minute! BIG DEAL? What’s the I can use a calculator and do it faster. I do not need Excel spreadsheet to add, subtract or multiply a few numbers! Well my friend, the BIG DEAL is ... an Excel equation can also refer to other cells within the worksheet and this enables you to do a great number of calculations very fast just with a few click of your mouse. Excel is much more than a fancy calculator! Go to the next slides.
Just an quick example to illustrate. Let’s calculate the volume and surface area of a box using the arithmetic equations I type the Length, Width and Height of a box in this table -> Look in the formula bar, you see “12” the height of the box. I type in red the formula to calculate the volume of the box -> Look at the formula bar. You do not see “45” or “25” or “12” see inside the formula. You see the “identification” of the cells that carry the Length, Width and Height . Same here. In green I type the formula to calculate the surface area of the box. (By the way, double-check quickly the formula in the formula bar! Is it the correct formula and did I refer to the proper cells? Nice, but I can use my calculator and do it faster!
You are right! If you have to do these calculations for ONE box only, using your calculator will be faster But what if you need to calculate the volume andsurface area of 16 boxes? Let’s race! I will use the Arithmetical equations (and refer to the appropriate cells) to calculate volume and surface area of the 1st box. THEN I will use the copy/paste tool to do the same 2 calculations for my 15 other boxes. You will do the same calculations using your calculator! Me: Less than 30 sec. You? 16 minutes! Pfff...
NOW – LETS GO BACK TO OUR BRAIN STORY AND LEARN HOW TO DO IT! 9-
In Excel 2we saw that the brains of French Women are significantly smaller (*) than their male counterparts * * It may just be because Females are smaller than Males and therefore we should standardise our data to correct for the difference in Body size. In this tutorial we will utilise the “arithmetic equations” feature of Excel to standardise our data. We will divide each brain weight by the body weight of its owner.
Learn how to insert an extra column Learn how to wrap text inside a cell Learn how to use Arithmetic Equations Learn how to make 2 graphs in less than 30 sec.
10- Remember the brain story? The brains of French Women seems to be significantly smaller (*) than their male counterparts... It may just be because Females are smaller than Males. Let’s standardise our data by dividing each brain weight by the body weight of its subject and see if we still get the same trend between genders. And we will use Excel arithmetic equations to do just that!
Moving the graph below the table TO Just click on the graph & drag it!
11- Moving the graph below the table Just click on the graph & drag it! TO For a demo click here ->
Table Inserting columns in the table to type the subjects’ Identification numbers and body weight TO The graph becomes all weird Do NOT PANIC! DO NOT DESPAIR!
12- Table Inserting subjects’ Identification numbers and their body weight in the table TO The graph becomes all weird Do NOT PANIC! DO NOT DESPAIR! For a demo click here ->
13- Using Arithmetic equations to standardise the brain weight For each subject, we will divide the brain weight by the body weight using the arithmetic formulae: Standardised brain size in g per kg body weight = (Brain weight in kg * 1000) / Body weight in kg ... and learn how to wrap text inside a cell TO Type the arithmetic equation in one cell then Copy & Paste it in the other cells! The graph becomes weirder Keep steady!
Table Inserting columns in the table to calculate their standardised brain weights & learning how to wrap text in cells Insert these two columns ... and learn how to wrap text inside a cell TO Type the arithmetic equation in one cell then Copy & Paste it in the other cells! The graph becomes weirder Keep steady!
Table Inserting columns in the table to calculate their standardised brain weights & learning how to wrap text in cells Insert these two columns ... and learn how to wrap text inside a cell Type the arithmetic equation in one cell then Copy & Paste it in the other cells! The graph becomes weirder Keep steady!
Table Using Arithmetic equations to standardise the brain weight For each subject, we will divide the brain weight by the body weight using the arithmetic formulae: Standardised brain size in g per kg body weight = (Brain weight in kg * 1000) / Body weight in kg TO Type the arithmetic equation in one cell then Copy & Paste it in the other cells! The graph becomes weirder Keep steady!
For a demo on how to wrap text inside a cell click here -> (if you just want to see the demo of the wrap, speed up right to the second half of the clip) For a demo on how to do arithmetic function click here ->
Table Calculating averages and confidence intervals of the body sizes and standardised brain weights of males and females Just Copy & Paste! TO Weirder & Weirder!
14- We calculate averages and confidence intervals of the body size and the standardised brain weight of our males and females Just Copy & Paste! TO Weirder & Weirder! For a demo click here ->
Fixing the “weird graph” -> we have 2 choices: • Either we delete it & make a new one from scratch (how? see Excel 2) • or we fix it (how? Select what you want to change in your old graph by clicking on it and just change it) TO
15- Graphing data-> we have 2 choices: Either we delete the old graph & make a new one from scratch (how? see Excel 2 to show how) or we fix the old graph (how? See demo on this slide) • Just select what you want to change in your old graph (click on it) and change it! TO For a demo click here ->
Making 2 new graphs in less than 30 sec! Copy & Paste Twice. Then click in these 2 graphs and make your changes! TO
Hey!If we standardise brain size relatively to body weight, there is no significant difference between genders. (*) In Biol 363 we will assume that means are significantly different from each other if their confidence intervals do not overlap - (in “real life” you should be doing proper statistical analysis!)