Download
1 / 5
60 likes | 195 Views
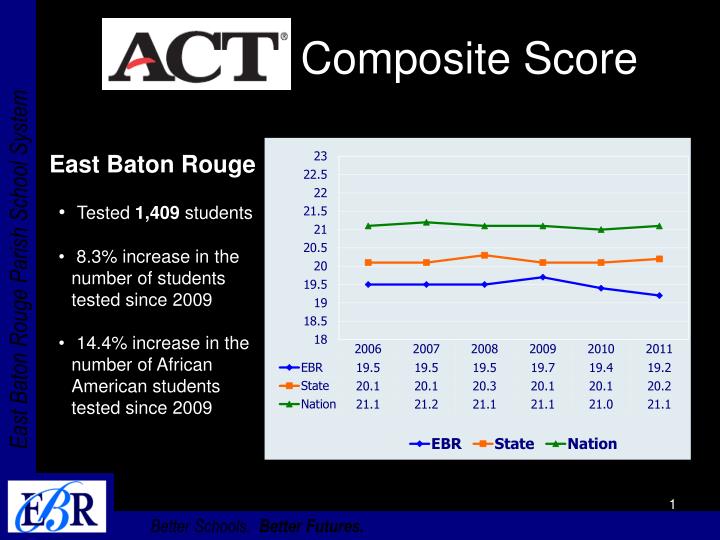
Composite Score. East Baton Rouge Tested 1,409 students 8.3% increase in the number of students tested since 2009 14.4% increase in the number of African American students tested since 2009. ACT 2008 to 2011 EBR Subject Area Scores. Subgroup Data.

E N D
Composite Score • East Baton Rouge • Tested 1,409 students • 8.3% increase in the number of students tested since 2009 • 14.4% increase in the number of African American students tested since 2009
Subgroup Data • African American - 70% of EBRPSS test takers Composite: EBR 17.7 State 17.5 Nation 17.0 • Caucasian - 14% of EBRPSS test takers Composite: EBR 23.9 State 21.7 Nation 22.4
EBRPSS Subgroup Datacontinued Asian American - 5% EBR 25.4 State 22.3 Nation 23.6 Gender Male – 39% Female – 61% EBR 19.6 18.9 State 20.5 20.1
Schools with Composite Score Gains Baton Rouge High* 25.0 to 25.8 Istrouma High 16.3 to 16.8 Scotlandville High 16.9 to 17.3 Broadmoor High 17.7 to 17.8 * Highest EBR school score