Download
1 / 1
10 likes | 130 Views
L. Site 2. RESULTS AND DISCUSSION Spatial distribution of enzyme activities and related soil properties Correlations between enzyme activity and clay content suggest that other constituents held by clays may influence activity (Tables 2 & 4).

E N D
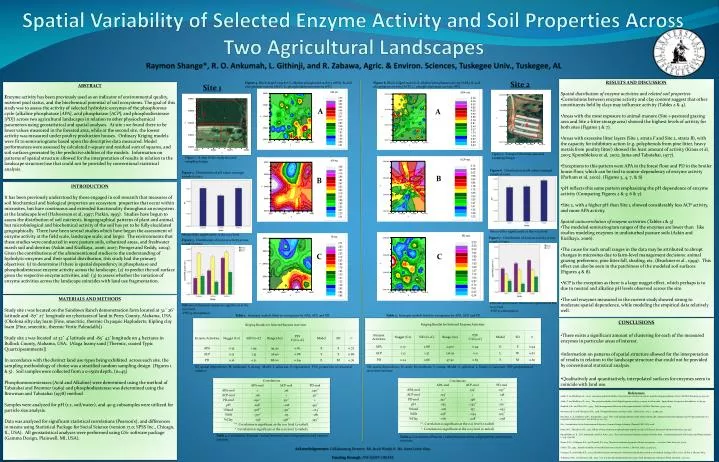
L Site 2 • RESULTS AND DISCUSSION • Spatial distribution of enzyme activities and related soil properties • Correlations between enzyme activity and clay content suggest that other constituents held by clays may influence activity (Tables 2 & 4). • Areas with the most exposure to animal manure (Site 1-pastured grazing area and Site 2-litter storage area) showed the highest levels of activity for both sites (Figures 3 & 7). • Areas with excessive litter layers (Site 1, strata F and Site 2, strata B), with the capacity for inhibitory action (e.g. polyphenols from pine litter, heavy metals from poultry litter) showed the least amount of activity (Kraus et al, 2003; Kpomblekou et al, 2002; Juma and Tabatabai, 1977). • Exceptions to this pattern were APA in the forest floor and PD in the broiler house floor, which can be tied to source-dependency of enzyme activity (Parham et al, 2002). (Figures 3, 4, 7, & 8) • pH reflects this same pattern emphasizing the pH dependence of enzyme activity (Comparing Figures 2 & 3; 6 & 7). • Site 2, with a higher pH than Site 1, showed considerably less ACP activity, and more APA activity. • Spatial autocorrelation of enzyme activities (Tables 1 & 3) • The modeled semivariogram ranges of the enzymes are lower than like studies modeling enzymes in undisturbed pasture soils (Askin and Kizilkaya, 2006). • The cause for such small ranges in the data may be attributed to abrupt changes in microsites due to farm-level management decisions: animal grazing preference, pine litter fall, shading, etc. (Bruckner et al., 1999). This effect can also be seen in the patchiness of the modeled soil surfaces (Figures 4 & 8). • ACP is the exception as there is a large nugget effect, which perhaps is to due to neutral and alkaline pH levels observed across the site. • The soil enzymes measured in the current study showed strong to moderate spatial dependence, while modeling the empirical data relatively well. Figure 4. Block-kriged map for A, alkaline phosphatase activity (APA); B, acid phosphatase activity (ACP); C, phosphodiesterase activity (PD). Figure 8. Block-kriged map for A, alkaline phosphatase activity (APA); B, acid phosphatase activity (ACP); C, phosphodiesterase activity (PD). X Site 1 ABSTRACT Enzyme activity has been previously used as an indicator of environmental quality, nutrient pool status, and the biochemical potential of soil ecosystems. The goal of this study was to assess the activity of selected hydrolytic enzymes of the phosphorous cycle (alkaline phosphatase [APA], acid phosphatase [ACP], and phosphodiesterase [PD]) across two agricultural landscapes in relation to other physiochemical parameters using geostatistical and spatial analyses. At site 1 we found there to be lower values measured in the forested area, while at the second site, the lowest activity was measured under poultry production houses. Ordinary Kriging models were fit to semivariograms based upon the descriptive data measured. Model performances were assessed by calculated r-square and residual sum of squares, and soil surfaces generated by the predictive abilities of the models. Information on patterns of spatial structure allowed for the interpretation of results in relation to the landscape structure/use that could not be provided by conventional statistical analysis. B Spatial Variability of Selected Enzyme Activity and Soil Properties Across Two Agricultural LandscapesRaymon Shange*, R. O. Ankumah, L. Githinji, and R. Zabawa, Agric. & Environ. Sciences, Tuskegee Univ., Tuskegee, AL A A F C P Figure 5. A map of the study area and sampling design. Figure 1. A map of the study area and sampling design. Figure 6. Distribution of pH values amongst sampled strata. Figure 2. Distribution of pH values amongst sampled strata. B B INTRODUCTION It has been previously understood by those engaged in soil research that measures of soil biochemical and biological properties are ecosystem properties that occur within microsites, but have continuous and extended functionality throughout an ecosystem at the landscape level (Halvosrson et al, 1997; Parkin, 1993). Studies have begun to assess the distribution of soil nutrients, biogeographical patterns of plant and animal, but microbiological and biochemical activity of the soil has yet to be fully elucidated geographically. There have been several studies which have begun the assessment of enzyme activity at the field scale, landscape scale, and larger. The environments that these studies were conducted in were pasture soils, urbanized areas, and freshwater marsh soil and detritus (Askin and Kizilkaya, 2006; 2007; Prenger and Reddy, 2004). Given the contributions of the aforementioned studies to the understanding of hydrolytic enzymes and their spatial distribution, this study had the primary objectives: (1) to determine if there is spatial dependency in phosphatase and phosphodiesterase enzyme activity across the landscape, (2) to predict the soil surface given the respective enzyme activities, and (3) to assess whether the variation of enzyme activities across the landscape coincides with land use fragmentation. Means differ significantly at the 0.05 level. Means differ significantly at the 0.05 level. Figure 7. Distribution of enzyme activity across sampled strata. Figure 3. Distribution of enzyme activity across sampled strata. C C MATERIALS AND METHODS Study site 1 was located on the Sundown Ranch demonstration farm located at 32˚ 26’ latitude and -87˚ 27’ longitude on 17hectares of land in Perry County, Alabama, USA. (Okolona silty clay loam [Fine, smectitic, thermicOxyaquicHapluderts; Kipling clay loam [Fine, smectitic, thermicVerticPaleudalfs]) Study site 2 was located at 32˚ 4’ latitude and -85˚ 42’ longitude on 4 hectares in Bullock County, Alabama, USA. (Alaga loamy sand [Thermic, coated TypicQuartzipsamments]) In accordance with the distinct land use types being exhibited across each site, the sampling methodology of choice was a stratified random sampling design (Figures 1 & 5). Soil samples were collected from a 0-15cm depth. (n=45) Phosphomonoesterases (Acid and Alkaline) were determined using the method of Tabatabai and Bremner (1969) and phosphodiesterase was determined using the Browman and Tabatabai (1978) method Samples were analyzed for pH (1:2, soil/water), and 40-g subsamples were utilized for particle size analysis. Data was analyzed for significant statistical correlations (Pearson’s), and differences in means using Statistical Package for Social Science (version 17.0; SPSS Inc., Chicago, IL, USA). All geostatistical analyses were performed using GS+ software package (Gamma Design, Plainwell, MI, USA). Differences between means are significant at the 0.05 level. -PNP, p-nitrophenol. Differences between means are significant at the 0.05 level. -PNP, p-nitrophenol. Table 1. Isotropic models fitted to variograms for APA, ACP, and PD. Table 3. Isotropic models fitted to variograms for APA, ACP, and PD. • CONCLUSIONS • There exists a significant amount of clustering for each of the measured enzymes in particular areas of interest. • Information on patterns of spatial structure allowed for the interpretation of results in relation to the landscape structure that could not be provided by conventional statistical analysis. • Qualitatively and quantitatively, interpolated surfaces for enzymes seem to coincide with land use. SD, spatial dependence: M, moderate; S, strong. Model: S, spherical; E, exponential. PSV, proportion of structural variance SD, spatial dependence; W, weak; M, moderate; S, strong. Model- S, spherical; L, linear; G, Gaussian. PSV, proportion of structural variance • References • Askin, T. and Kizilkaya, R., 2006. Assessing spatial variability of soil enzyme activities in pasture topsoils using geostatistics. Eur. J. Soil Biol. Biochem. 42:230-237. • Askin, T. and Kizilkaya, R., 2007. The spatial variability of soil dehydrogenase activity: a survey in urban soils. Agriculturae Conspectus Scientificus, 72: 89-94. • Bandick, A.K., and Dick, R.P., 1999. Field management effects on soil enzyme activities, Soil Biol. Biochem. 31:1471–1479. • Browman, M.G. and Tabatabai, M.A., 1978. Phosphodiesterase activity in soils. Soil Sci. Soc. Am. J. 42:284-290. • Bruckner, A., E. Kandeler, and C. Kampichler , 1999. Plot–scale spatial patterns of soil water content, pH, substrate-induced respiration and N mineralization in a temperate coniferous forest. Geoderma 93: 207–223. • GS+, Geostatistics for the Environmental Sciences, Gamma Design Software, Plainwell, MI, USA, 2008. • Juma, N.G., Tabatabai, M.A., 1977. Effects of trace elements on phosphatase activity in soils. Soil Science Society of America Journal 41, 343–346. • Kpomblekou-A, K. , R.O. Ankumah, and H.A. Ajwa. 2002. Trace and nontrace element contents of broiler litter. Communications in Soil Science and Plant Analysis, v. 33 p. 1799-1811. • Kraus, T.E.C., Dahlgren, R.A., and Zasoski, R.J. 2003. Tannins in nutrient dynamics of forest ecosystems — a review. Plant Soil, 256: 41–66. • Parkin, T.B., 1993. Spatial variability of microbial processes in soil: a review, J. Environ. Qual. 22:409–417. • Prenger, J.P., and Reddy, K.R., 2004. Microbial enzyme activities in a freshwater marsh after cessation of nutrient loading. Soil Sci. Soc. Of Am. J. 68:1796–1804. • Tabatabai, M.A., and Bremner, J.M., 1969. Use of p-nitrophenyl phosphate for assay of soil phosphatase activity, Soil Biol. Biochem. 1:301–307. Table 2. Correlations (Pearson r value) between some soil properties and enzyme activities. Table 4. Correlations (Pearson r value) between some soil properties and enzyme activities. Acknowledgements: Collaborating Farmers- Mr. Jacob Waddy & Ms. Gwen Lewis-Gray Funding through: NSF IGERT-CREATE