Download
1 / 26
260 likes | 371 Views
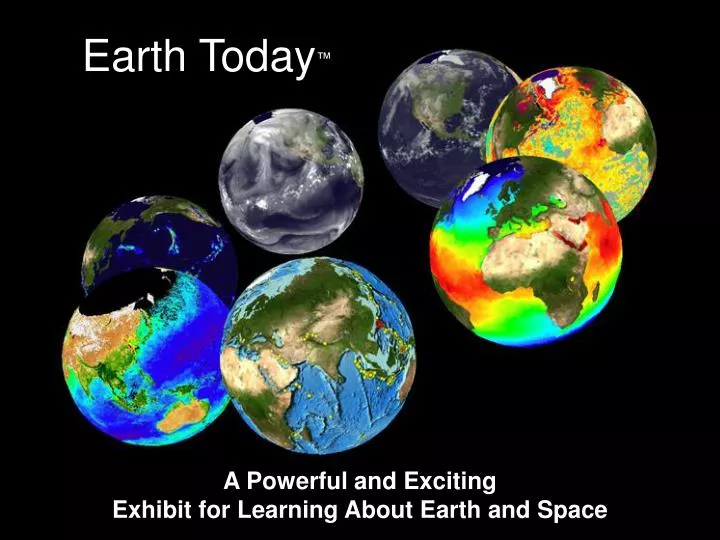
Earth Today ™. A Powerful and Exciting Exhibit for Learning About Earth and Space. Earth Today.

E N D
Earth Today™ A Powerful and Exciting Exhibit for Learning About Earth and Space
Earth Today Earth Today (ET) is an exhibit that displays near-real-time earth and space data. Narration can also be frequently updated by scientists to explain near-real-time events. Narration is both screen text and a voice over. New data sets can be easily incorporated.
How Does Earth Today Work? ET operates by ingesting global data sets from NASA, NOAA, and USGS into our central server. The central server pre-processes the data into images and stores them for download onto ET Display Systems. ET Display Systems automatically download new images every day from the central server through a high-speed, internet connection. High-speed internet connection High-speed internet connection Global Data Sets From Operational Servers Central Ingest Server • Collects current data • Pre-processes data into global images • Imports available text updates. Museum Display Server uploads processed images and text from central server daily.
Earth Today Narration Update • Scientists who participate in Earth Today program can • View ET on their computers and use it in presentations. • Modify the text through a secure website. • Modified text is then included in next update to Display Servers. Central Ingest Server Global Data Sets From Operational Servers Display Server Voice Over and Screen Text updated on Central Ingest Server for upload to Display Servers PI logs on to secure ET website at this/her convenience and updates screen text and narration. PI reviews ET on his/her personal computer.
Museums Scientists • ET is a robust, cost effective, easy to maintain display that are content-rich and always current and compelling. • The ET display systems are delivered and set up as complete, operational systems, requiring no customer technical expertise. • Museums need only to provide power and a high-speed internet connection. • - Scientists have their data shown wherever ET is displayed. • Scientists are able to view ET on their PC and update their text and voice through a secure website. • Scientists can contribute to the “Notable Events” menu on the interactive Kiosk. • - ET provides unprecedented outreach exposure. • Scientists play an integral role in the development of science-driven movies in the ET “Learning Center”. • Movies are available in formats ranging from HD to QT.
Earth Today Passive Display The Passive system consists of a computer, a projector or monitor, and a high-speed internet connection. Daily updates of earth and space observations and narration, make ET the most powerful and exciting tool available for viewing dynamic planets. The system is designed to easily allow our scientists to update the voice over and screen text through a secure website in order to draw attention to significant events. Screen captures of Rainfall and Earthquakes from ET Passive Display
Earth Today Interactive Kiosk The ET Interactive Kiosk features a display screen and a touch screen with selection tools that control the display. The ET Interactive Kiosk, has two sections, the Interactive Center and the Learning Center. Viewing screen Touch screen
Earth Today Kiosk Configurations The Interactive Center: Using a touch screen, viewers are able to manipulate the display. Viewers can choose a data set, the dates viewed, or choose from the“notable events” menu. Viewers control the global orientation and rotation, compare archived data to current data, or zoom into a particular region. Viewers can also overlay a second data set and adjust the transparency. The Learning Center: The Learning Center consists of a number of short, educational movies that provide information about the ET data sets and the science behind them. Additional movies are added through the high speed internet connection.
Earth Today Interactive Center The Interactive Center has three interactive panels. The first panel allows viewers to choose a data set. Viewers can select an optional second data set to overlay the first. The degree of transparency of the second data set is adjustable. Touch screen Upper viewing screen
Earth Today Interactive Center The second panel allows the viewer to choose the time period. The latest 30 days, a continuous sequence, the same period over multiple years, or select a preset from the “Notable Event” menu.
Earth Today Interactive Center The third panel allows viewers to adjust the rotation speed or stop the globe, change the speed of data advancement, adjust the globe orientation, or zoom into a region of interest.
Earth Today “Learning Center” The Learning Center contains a number of short, educational movies about the ET data sets and the science behind them. Each movie uses a combination of data, graphs, conceptual animations, and videos to craft a complete story. The Learning Center has two sections: Mission specific movies and Theme-based movies. Mission Specific Movies: • What is the Satellite and instrument sensors? • What part of the IR spectrum is observed? • What are the science questions? • What are the science results? • How is this relevant and why should I care? • Other interesting, relevant science stories. As additional movies are developed, they are automatically added to the ET server.
Earth Today “Learning Center” Display Screens Theme Movies: Explain earth and space science themes that cut across several ET data sources, such as Climate Change, and the Carbon Cycle. Touch Screen
How Do Scientists Update Their Text? Scientists can log onto a secured website to update the text that appears on the screen and the voice over. They can play a preview the text-to-speech on the website before submitting the updates to the Earth Today ingest server.
Earth Today Earth Today (ET) is an exhibit that displays near-real-time earth science data. • The data is displayed as a rotating global image with accompanying narration and screen text. • ET operates by downloading global data sets from operational servers into a central server which pre-processes the data into images and stores them for museum display systems. • The ET museum display system automatically downloads the images from the ET server through a broadband connection, updating the museum display several times a day. • The capability exists to add any number of global data sets to the system. To operate this exhibit, museums need a Macintosh G5, a projection device (such as a projector or monitor), and a broadband connection. ET is presently displayed at the Smithsonian Air & Space Museum, the Maryland Science center, and the NASA GSFC visitors center. Screen capture of Rainfall from ET exhibit
Earth Today Two new ET developments underway: • The Learning Center. • The Website will contain movies, fac sheets, and links. The initial code was developed at NASA GSFC. The continuing code development is by a private company, Animated-Earth LLC. For more information see: http://animated-Earth.com or contact Barbara Schoeberl at Barbara@animated-earth.com Screen capture of Earthquakes from ET exhibit
This is a poster, but I can imagine comparing human events like this compared to natural events with photos on SOS
Hadley CycleI can imagine overlays like trade winds and the Hadley Cycle on SOS. See the QT on this disk. The rotation of the arrows could be adapted to moving arrow overlays for SOS.
Global ConveyorIt would be easy for me to make a conveyor overlay for SOS. This illustration has more detail than the following one.
Ocean ConveyorIt would be easy for me to make a conveyor overlay like this for SOS. This illustration has less detail than the previous one.
MODIS LayersThis is a concept draft, where the discussion of the IR spectrum and the significance of the signature influences what bands we choose to look at to emphasize different results with the data. See the QT on this disk.
CO Measured by MOPITTThis is a data animation of CO, which could be compared to model data.You can really tell who uses energy or biomass burning. The time bar could be placed along the equator or on a side screen. See the QT on this disk.
TRMM Swath movieThis is another animation of a satellite making measurements. There are only two passes to show how the swaths overlap. See the QT on this disk.
SARThis movie was designed for another purpose, but I can imagine this technique as a way of drilling into a local region on SOS, placing the drilled-down frames along the center third of the sphere. See the movie on this disk.