Download
1 / 1
10 likes | 166 Views
Altitude (km). Troposphere/Stratosphere Exchange and Influence of Solar Variability of examples of coupling of chemistry and dynamics in the middle atmosphere

E N D
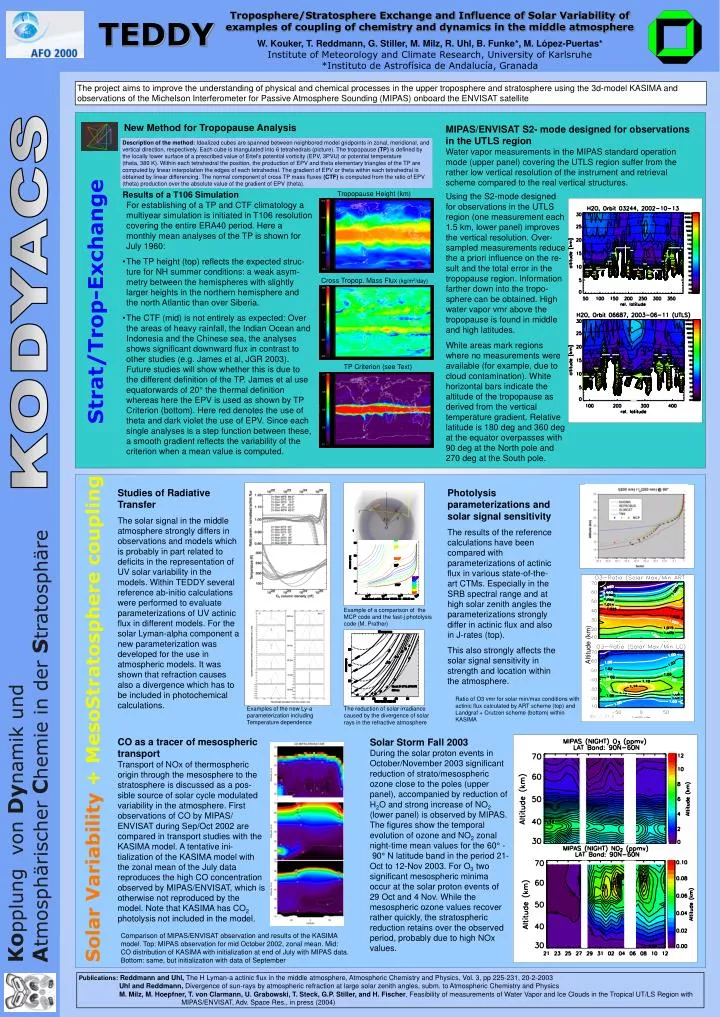
Altitude (km) Troposphere/Stratosphere Exchange and Influence of Solar Variability of examples of coupling of chemistry and dynamics in the middle atmosphere W. Kouker,T. Reddmann, G. Stiller, M. Milz,R. Uhl, B. Funke*, M. López-Puertas*Institute of Meteorology and Climate Research, University of Karlsruhe*Instituto de Astrofísica de Andalucía, Granada TEDDY The project aims to improve the understanding of physical and chemical processes in the upper troposphere and stratosphere using the 3d-model KASIMA and observations of the Michelson Interferometer for Passive Atmosphere Sounding (MIPAS) onboard the ENVISAT satellite New Method for Tropopause Analysis MIPAS/ENVISAT S2- mode designed for observations in the UTLS region Water vapor measurements in the MIPAS standard operation mode (upper panel) covering the UTLS region suffer from the rather low vertical resolution of the instrument and retrieval scheme compared to the real vertical structures. Description of the method: Idealized cubes are spanned between neighbored model gridpoints in zonal, meridional, and vertical direction, respectively. Each cube is triangulated into 6 tetrahedrals (picture). The tropopause (TP) is defined by the locally lower surface of a prescribed value of Ertel's potential vorticity (EPV, 3PVU) or potential temperature (theta, 380 K). Within each tetrahedral the position, the production of EPV and theta elementary triangles of the TP are computed by linear interpolation the edges of each tetrahedral. The gradient of EPV or theta within each tetrahedral is obtained by linear differencing. The normal component of cross TP mass fluxes (CTF) is computed from the ratio of EPV (theta) production over the absolute value of the gradient of EPV (theta). • Results of a T106 Simulation For establishing of a TP and CTF climatology a multiyear simulation is initiated in T106 resolution covering the entire ERA40 period. Here a monthly mean analyses of the TP is shown for July 1960: • The TP height (top) reflects the expected struc-ture for NH summer conditions: a weak asym-metry between the hemispheres with slightly larger heights in the northern hemisphere and the north Atlantic than over Siberia. • The CTF (mid) is not entirely as expected: Over the areas of heavy rainfall, the Indian Ocean and Indonesia and the Chinese sea, the analyses shows significant downward flux in contrast to other studies (e.g. James et al, JGR 2003). Future studies will show whether this is due to the different definition of the TP. James et al use equatorwards of 20° the thermal definition whereas here the EPV is used as shown by TP Criterion (bottom). Here red denotes the use of theta and dark violet the use of EPV. Since each single analyses is a step function between these, a smooth gradient reflects the variability of the criterion when a mean value is computed. Tropopause Height (km) Using the S2-mode designed for observations in the UTLS region (one measurement each 1.5 km, lower panel) improves the vertical resolution. Over-sampled measurements reduce the a priori influence on the re-sult and the total error in the tropopause region. Information farther down into the tropo-sphere can be obtained. High water vapor vmr above the tropopause is found in middle and high latitudes. White areas mark regions where no measurements were available (for example, due to cloud contamination). White horizontal bars indicate the altitude of the tropopause as derived from the vertical temperature gradient. Relative latitude is 180 deg and 360 deg at the equator overpasses with 90 deg at the North pole and 270 deg at the South pole. Cross Tropop. Mass Flux (kg/m2/day) Strat/Trop-Exchange TP Criterion (see Text) Studies of Radiative Transfer The solar signal in the middle atmosphere strongly differs in observations and models which is probably in part related to deficits in the representation of UV solar variability in the models. Within TEDDY several reference ab-initio calculations were performed to evaluate parameterizations of UV actinic flux in different models. For the solar Lyman-alpha component a new parameterization was developed for the use in atmospheric models. It was shown that refraction causes also a divergence which has to be included in photochemical calculations. Photolysis parameterizations and solar signal sensitivity The results of the reference calculations have been compared with parameterizations of actinic flux in various state-of-the-art CTMs. Especially in the SRB spectral range and at high solar zenith angles the parameterizations strongly differ in actinic flux and also in J-rates (top). This also strongly affects the solar signal sensitivity in strength and location within the atmosphere. Example of a comparison of the MCP code and the fast-j photolysis code (M. Prather) Solar Variability + MesoStratosphere coupling Ratio of O3 vmr for solar min/max conditions with actinic flux calculated by ART scheme (top) and Landgraf + Crutzen scheme (bottom) within KASIMA Examples of the new Ly-a parameterization including Temperature dependence The reduction of solar irradiance caused by the divergence of solar rays in the refractive atmosphere CO as a tracer of mesospheric transportTransport of NOx of thermospheric origin through the mesosphere to the stratosphere is discussed as a pos-sible source of solar cycle modulated variability in the atmosphere. First observations of CO by MIPAS/ ENVISAT during Sep/Oct 2002 are compared in transport studies with the KASIMA model. A tentative ini-tialization of the KASIMA model with the zonal mean of the July data reproduces the high CO concentration observed by MIPAS/ENVISAT, which is otherwise not reproduced by the model. Note that KASIMA has CO2 photolysis not included in the model. Solar Storm Fall 2003 During the solar proton events in October/November 2003 significant reduction of strato/mesospheric ozone close to the poles (upper panel), accompanied by reduction of H2O and strong increase of NO2 (lower panel) is observed by MIPAS. The figures show the temporal evolution of ozone and NO2 zonal night-time mean values for the 60° - 90° N latitude band in the period 21-Oct to 12-Nov 2003. For O3 two significant mesospheric minima occur at the solar proton events of 29 Oct and 4 Nov. While the mesospheric ozone values recover rather quickly, the stratospheric reduction retains over the observed period, probably due to high NOx values. Comparison of MIPAS/ENVISAT observation and results of the KASIMA model. Top: MIPAS observation for mid October 2002, zonal mean. Mid: CO distribution of KASIMA with initialization at end of July with MIPAS data. Bottom: same, but initialization with data of September Publications: Reddmann and Uhl, The H Lyman-a actinic flux in the middle atmosphere, Atmospheric Chemistry and Physics, Vol. 3, pp 225-231, 20-2-2003Uhl and Reddmann, Divergence of sun-rays by atmospheric refraction at large solar zenith angles, subm. to Atmospheric Chemistry and PhysicsM. Milz, M. Hoepfner, T. von Clarmann, U. Grabowski, T. Steck, G.P. Stiller, and H. Fischer, Feasibility of measurements of Water Vapor and Ice Clouds in the Tropical UT/LS Region with MIPAS/ENVISAT, Adv. Space Res., in press (2004)