Download
1 / 64
640 likes | 732 Views
WATER BALANCE FOR LAND DISPOSAL OF PRETREATED WASTEWATER EFFLUENTS. Background. What IS a Water Balance?.

E N D
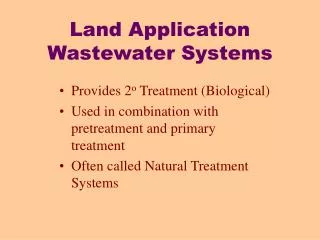
WATER BALANCE FOR LAND DISPOSAL OF PRETREATED WASTEWATER EFFLUENTS
What IS a Water Balance? Definition: A water balance is an assessment of the major components of a hydrologic system and includes the interactions between surface water and ground water systems. It provides a general understanding of the magnitude of recharge and discharge components.
Physical Mechanisms to Consider in a Water Balance • When the effluent is applied to land: • It may enter the subsurface through infiltration • It may evaporate and return to the atmosphere
Where the Infiltrated Water Goes • First, the effluent will hit the • Where interparticle voids contain soil, moisture and air! • Then it might enter the saturated zone, or • Return to the atmosphere by plants via evapotranspiration unsaturated zone
Other Water Balance Considerations In addition to the applied effluent, Don’t forget the rainfall!
Infiltration • Definition: Infiltration is the movement of water through the soil surface and into the soil itself.
Infiltration Rates • Definition: The rate at which the water actually enters the soil! • Are a function of: • Soil type • Effluent quality • Drying time between effluent applications • Etc.
Conservative Infiltration Rates * Clay Soils - Should not exceed 0.01 ft/day Sandy Soils - Should not exceed 0.03 ft/day *Based on the infiltration surface being dried and disked/ripped at least annually.
Key Concerns • Maintaining minimum 5 foot clearance from groundwater. • Ensuring percolated effluent does not resurface in immediate vicinity (often due to land slope and impervious strata). • Run-off • Groundwater mounding and/or lateral movement of water due to impervious strata.
Evaporation • Definition: The transformation of water from the liquid to the vapor state. Source: http://www.videoweather.com/weatherquestions/What_is_evaporation.htm
How Do You Get Evaporation Data?? • Evaporation data from open water (PAN) surfaces are available from local/state authorities. An evaporation pan Source: http://www.sws.uiuc.edu/atmos/statecli/Instruments/weather_instruments.htm
Calculating Site Specific Evaporation Rates E: Design evaporation rate [in/month] EP: PAN evaporation rate for month and location being studied [in/month] CP: PAN coefficient to correct for excess evaporation. Usually 0.8. [-] k: Weather correction factor Where,
Relationship Between Precipitation and PAN Evaporation Source: Data points obtained from the Statewide IPM Program, Agriculture and Natural Resources, University of California (www.ipm.ucdavis.edu)
Obtaining Rainfall Data • Available from local/state/federal authorities such as: • the Department of Water Resources • the University of California, Davis • National Weather Service The following table shows both PAN and rainfall data obtained from UC Davis.
Evapotranspiration Source: http://wwwcimis.water.ca.gov/cimis/infoEtoOverview.jsp
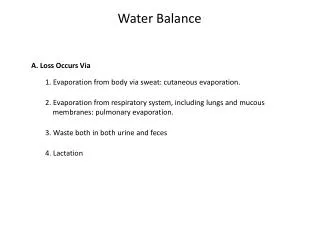
What is Evapotranspiration (ET)? • A combination of two processes: 1) Evaporation – Loss of water from a vegetated field through vaporization of water from soil and plant surfaces. 2) Transpiration – Water, taken into the plant through the root system, passes through pores and evaporates into the atmosphere. Evaporation + Transpiration = Evapotranspiration
Factors Affecting ET • Location • Crop Type • Season • Irrigation Practices
Finding ET Information • Government agencies will usually have something called the: • ETo is a function of: • Location • Time • Weather Reference Evapotranspiration Rate! (or ETo)
CIMIS ETo Reference Crop • The California Irrigation Water Management System (CIMIS)1 uses the following reference crop: • Grass • Closely clipped • Actively growing • Completely shading the soil • Well watered 1 www.cimis.water.ca.gov
Calculating Crop Specific ETo kc: Crop coefficient (ratio of ETc to ETo) ETc: For crop of interest [in/unit time] Where,
CIMIS Normal Year ETo Zones for California Source: http://wwwcimis.water.ca.gov/cimis/ images/etomap.jpg
CIMIS Map • Divides the state into 18 zones • Provides average year Etos for each zone for each month. • Estimated standard deviation: 0.01 in/month Other Applications • Apply crop coefficients (kc) to ETo to get crop specific ETc. • Crop coefficients can be found at CIMIS web site.
Other ET Facts • Largest ETcs come from irrigated pasture grasses. • Maximum ETc roughly 0.7 time PAN evaporation rate. • Little to no ET may occur during field preparation, harvesting, or other operations.
The First Things You’ll Need to Know About Designing a Land Disposal System • Location of land disposal system: • Davis, CA (surprise, surprise) • Area Soil Type: • Predominately clay-based • Subsurface conditions will not limit infiltration rates. • Design for 1-in-100 year wet season. • Estimated AWWF1-100 ~ 1.2 MGD • ADWF = 1.0 MGD
Rainfall Depth-Duration-Frequency (DDF) Information Source: California Department of Water Resources, Division of Flood Management, Hydrology Branch
Step 1 – Development of Monthly Disposal Potential • Some calculations need to be done: Monthly 100 RP Rainfall Events: Where, 2.072 = Value for RP 100 for 30 days (see previous slide) / Average value (found in Appendix O) = 14.36 in / 17.31 in Average Rainfall: From Davis average water year data table.
1 in 100 Year Rainfall Event Pond Evaporation Where, Cp = 0.8 (typical value) k= 0.922 (from Precipitation vs. PAN Evaporation chart, k = -0.0569[Average Precipitation] + 1.04) PAN Evaporation: From water year data from the City of Davis
Monthly Infiltration Where, kinf= 0.01 feet/day (from equation)
Losses or Gains from Pond and Disposal Area Ponds: Disposal Area:
Step 2 – Analysis of Table of Disposal Potential DISPOSAL • Disposal area used from March through October • Disposal potential of 61 in/year under 1-in-100 year conditions.
Step 2 (Cont.) – Analysis of Table of Disposal Potential STORAGE/RUN-OFF • Disposal area gains water from Dec. through Feb. • Must store rainwater or let it run off. • Run-off approach normally taken when there is a large disposal area. • Requires that disposal area not receive effluent for one month prior to run-off (for this case, November is reserved for drying out period).
Step 2 (Cont.) – Analysis of Table of Disposal Potential STORAGE/RUN-OFF (CONT.) • All effluent stored from November through February. • Likely effluent storage in latter half of October. • Likely effluent storage in March. • Limited storage necessary in early April (based on monthly pond gain/loss)
Step 2 (Cont.) – Analysis of Table of Disposal Potential • 1-in-100 year storage pond disposal: • –69.8 in/year
Step 3 – Estimation of Annual Flow, Storage Volume and Pond Area
Annual Flow Calculate Approximate Annual Flow: 7 months: Number of disposal months (April – October) 1.2 MGD: Flow during wet months (AWWF) 5 months: Number of storage months (November – March) 1.0 MGD: Flow during disposal months (ADWF)
Annual Flow and Storage Volume Note: Flows used for this estimate are the flows provided in the initial assumptions. A more thorough approach must correlate rainfall and flow into the plant to include infiltration/inflow phenomena.
Estimating Pond Area • Assume typical pond depth of 12 feet
Step 4 – Estimation of Disposal Potential of Storage Volume • Based on a net pond loss of 69.8 in/year About 109 MG of stored effluent can be disposed of per year.
Step 5 – Estimation of Disposal Area • Need: • Disposal area capable of accommodating approximately:
Calculate Disposal Area • Recall a net loss from disposal area of 60.97 in/year during March through October.
Further Calculations Flow to Disposal Area: