Download
1 / 36
360 likes | 364 Views
Neural Test Theory: A nonparametric test theory using the mechanism of a self-organizing map. SHOJIMA Kojiro The National Center for University Entrance Examinations, Japan shojima@rd.dnc.ac.jp. Neural Test Theory (NTT). Shojima (2008) IMPS2007 CV , in press.

E N D
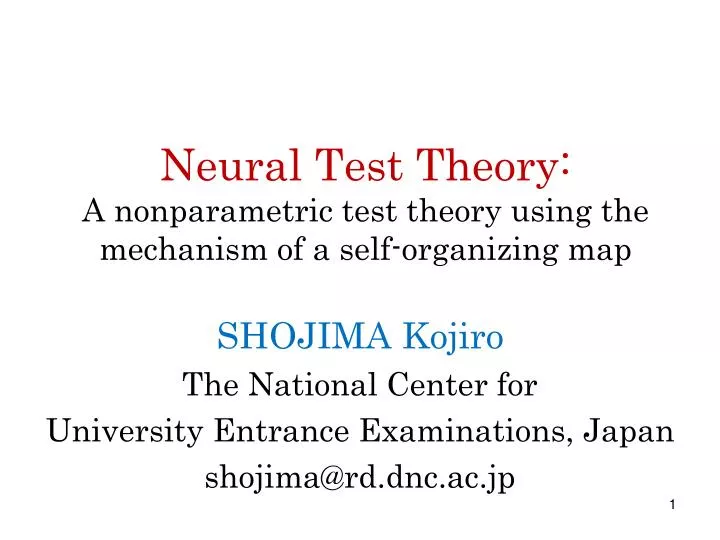
Neural Test Theory:A nonparametric test theory using the mechanism of a self-organizing map SHOJIMA Kojiro The National Center for University Entrance Examinations, Japan shojima@rd.dnc.ac.jp
Neural Test Theory (NTT) • Shojima (2008) IMPS2007 CV, in press. • Test theory using the mechanism of a self-organizing map (SOM; Kohonen, 1995) • Scaling • Latent scale is ordinal. • Latent rank • Number of latent ranks is about [3, 20] • Item Reference Profile • Test Reference Profile • Rank Membership Profile • Equating • Concurrent calibration
Why an Ordinal Scale? Two main reasons: • Methodological • Sociological
Methodological Reason • Psychological variables are continuous • Reasoning, reading comprehension, ability… • Anxiety, depression, inferiority complex… • Tools do not have high resolution for measuring them on a continuous scale • Tests • Psychological questionnaires • Social investigation
3 4 1 2 Weight and Weighing Machine • Phenomenon (continuous) • Measure (high reliability) Weight
Ability and Test • Phenomenon (continuous?) • Measure (low reliability) 4 3 2 1 Ability
Resolution • Power to detect difference(s) • Weighing machines • can detect the difference between two persons ofalmost the same weight. • can almost correctly array people according to their weights on the kilogram scale. • Tests • cannot discriminate the difference between two persons ofnearly equal ability. • cannot correctly array people according to their abilities. • The most that tests can do is to grade examinees into several ranks.
Sociological Reason • Negative aspects of continuous scale • Students are motivated to get the highest possible scores. • They should not be pushed back and forth by unstable continuous scores. • Positive aspects of ordinal scale • Ordinal evaluation is more robust than continuous scores. • Sustained endeavor is necessary to go up to the next rank.
NTT • ML (RN07-04) • Fitness (RN07-05) • Missing (RN07-06) • Equating (RN07-9) • Bayes (RN07-15)
Statistical Learning of the NTT ・For (t=1; t ≤ T; t = t + 1) ・U(t)←Randomly sort row vectors of U ・For (h=1; h ≤ N; h = h + 1) ・Obtain zh(t)from uh(t) ・Select winner rank for uh(t) ・Obtain V(t,h) by updating V(t,h−1) ・V(t,N)←V(t+1,0) Point 1 Point 2
1 0 1 1 1 1 1 0 0 1 0 0 Number of items 0 0 0 1 0 1 0 0 0 0 0 1 Mechanism of Neural Test Theory Response Point 1 Point 2 Point 1 Point 2 Latent rank scale
Point 1: Winner Rank Selection The least squares method is also available. Likelihood ML Bayes
Point 2: Reference Matrix Update • The nodes of the ranks nearer to the winner are updated to become closer to the input data • h: tension • α: size of tension • σ: region size of learning propagation
Analysis Example • Geography test
IRP of Item 25 IRP of Item 14 Item Reference Profile(IRP)
IRPs of Items 1–15 (ML, Q=10) The monotonic increasing constraint can be imposed on the IRPs in the learning process.
IRP index (1) Item Difficulty • Beta • Rank stepping over 0.5 • B • Its value Kumagai (2007)
IRP index (2) Item Discriminancy • Alpha • Smaller rank of the neighboring pair with the biggest change • A • Its value
IRP index (3) Item Monotonicity • Gamma • Proportion of neighboring pairs with negative changes. • C • Their sum
Item Reference ProfileEstimate IRP indices
Can-Do Table (example) IRP indices Ability category and item content IRP estimates
Test Reference Profile (TRP) • Weakly ordinal alignment condition • Satisfied when the TRP is monotonic, but not every IRP is monotonic. • Strongly ordinal alignment condition • Satisfied when all the IRPs are monotonic. TRP is monotonic. • The scale is not ordinal unless at least the weak condition is satisfied. • Weighted sum of the IRPs • Expected score of each latent rank
Model-Fit Indices ML, Q=10 ML, Q=5 • Fit indices are helpful in determining the number of latent ranks.
Latent Rank Estimation • Identical to the winner rank selection Likelihood ML Bayes
Latent Rank Distribution (LRD) • LRD is not always flat • Examinees are classified according to the similarity of their response patterns.
Stratified Latent Rank Distribution LRD stratified by sex LRD stratified by establishment
Relationship between Latent Ranks and Scores • R-S scatter plot • Spearman’s R=0.929 • R-Q scatter plot • Spearman’s R=0.925 Validity of the NTT scale
Rank Membership Profile (RMP) • Posterior distribution of latent rank to which each examinee belongs RMP
Extended Models • Graded Neural Test Model (RN07-03) • NTT model for ordinal polytomous data • Nominal Neural Test Model (RN07-21) • NTT model for nominal polytomous data • Batch-type NTT Model (RN08-03) • Continuous Neural Test Model • Multidimensional Neural Test Model
Graded Neural Test Model Boundary Category Reference Profiles of Items 1–9Dashed lines are observation ratio profiles (ORP)
Graded Neural Test Model Boundary Category Reference Profiles of Items 1–9Dashed lines are observation ratio profiles (ORP)
Nominal Neural Test Model Item Category Reference Profiles of Items 1–16* correct choice, x merged category of choices with selection ratios of less than 10%
Discussion • Test standardization theory • Self-Organizing Map • Latent scale is ordinal • IRPs are flexible and nonlinear • Test editing • CBT and CAT • Test equating • Concurrent calibration • Application • Japan’s National Achievement Test for 6th and 9th graders
Website http://www.rd.dnc.ac.jp/~shojima/ntt/index.htm • Software • Neutet • Developed by Professor Hashimoto (NCUEE) • Available in Japanese and English versions • EasyNTT • Developed by Professor Kumagai (Niigata Univ.) • Japanese version only