Download
1 / 16
170 likes | 373 Views
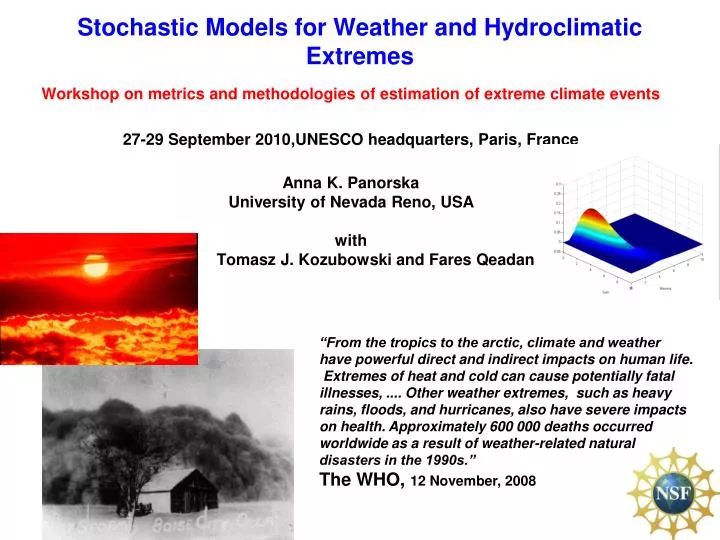
Stochastic Models for Weather and Hydroclimatic Extremes. Workshop on metrics and methodologies of estimation of extreme climate events 27-29 September 2010,UNESCO headquarters, Paris, France Anna K. Panorska University of Nevada Reno, USA with

E N D
Stochastic Models for Weather and Hydroclimatic Extremes Workshop on metrics and methodologies of estimation of extreme climate events 27-29 September 2010,UNESCO headquarters, Paris, France Anna K. Panorska University of Nevada Reno, USA with Tomasz J. Kozubowski and Fares Qeadan “From the tropics to the arctic, climate and weather have powerful direct and indirect impacts on human life. Extremes of heat and cold can cause potentially fatal illnesses, .... Other weather extremes, such as heavy rains, floods, and hurricanes, also have severe impacts on health. Approximately 600 000 deaths occurred worldwide as a result of weather-related natural disasters in the 1990s.” The WHO, 12 November, 2008
Outline • MOTIVATION: Extreme hydroclimatic and weather events, e.g. drought, flood, or heat waves. • Examples: Paris heat wave, August 2003. • Great Drought of the 1930s in the USA, THE “DUST BOWL”. • STOCHASTIC MODELS: First joint model for duration, magnitude and maximum of events • EXAMPLE: Back to the “Dust Bowl” and Paris heat wave • Summary
From observations to events Original precipitation data in standard deviation units plotted as difference from a threshold. Precipitation “events” or “episodes”. Threshold Episodes: wet and dry An episode is a period with the process staying consecutively above/below threshold: e.g. drought, flood, heat wave, etc. Threshold for “dry” or “wet” depends on the definition of the episode (e.g. drought). Data: Dendroclimatic (western juniper) reconstruction of precipitation from 300 BC to AD 2001 in the Walker River watershed (California/Nevada). California Climate Division 3.
Climatological/weather Events: Visualizing Intuition Positive events Start with a process: DURATION = the number of years/time periods in one event : random = N. Negative events threshold MAGNITUDE = area of the shaded region = random sum of the series values for one event. MAXIMUM = max observation during an event = random maximum of the series values for one event. Kozubowski and Panorska (2005), (2008), Biondi, Kozubowski and Panorska (2005), Biondi et al. (2008).
RANDOM VECTOR GOAL: Construct a mathematically natural, that is reflecting the construction of (N, X, Y), model(s) for the JOINT distribution of (duration, magnitude X and maximum Y) of events. • Notable properties of the random vector (N, X, Y): • All components are related/dependent; • The sum and maximum are of random number of random observations; • The joint behavior of X and Y is not trivial.
CONSTRUCTION OF THE MODEL FOR (N, X, Y) = (duration, magnitude, maximum) Hierarchical approach: • Specify distribution of N • Given N=n, find conditional distr. of (X, Y|N=n) = 3. Get the joint distribution of (N, X, Y) as
History of the joint distribution of magnitude and maximum Only asymptotics for large n were done for exponential observations. Appropriate normalization Normal Extreme value distribution independent Levy 1953; D.Z. Arov and A. A. Bobrov 1960; Chow and Teugels 1978; Woodroofe and Zinn 1981; Maller and Resnick 1983; Peter J. Haas 1992.
KEY NEW RESULT: PDF of the Bivariate Distribution of the Random Sum and Max for any n is given explicitly by Let Xi, i=1, …, n, n ≥ 2, be iid exp(β). The joint pdf of (X, Y)= and S0={(x,y): x=y>0} while This new distribution is called BGGE(β, n) for bivariate distribution with gamma and generalized exponential marginals. Qeadan, Kozubowski, Panorska (2010), Communication in Statistics: Theory and Methods, to appear.
Covariance Structure (X, Y)~ BGGE(β, n). EX=n/ β, EY=(ψ(n+1)+γ)/ β, corr(X, Y) is where ψ and ψ’ are the digamma and polygamma functions, respectively, and γ is the Euler constant. NOTE: ρn→0, but very slowly. Thus, approximation of (X, Y) with independent X and Y is not good even for large n. E.g. ρ500 =0.24
New Stochastic Model: Joint Distribution of the Duration, Magnitude and Maximum of an Episode N-random N-Geo(p), Xi’s iid exp(β) ind. of N. Trivariate distribution with exponential, truncated logistic and geometric marginals1. The pdf of (X, Y, N) is where function H is given in the pdf of the (X,Y|N=n) 1 Kozubowski, Panorska, Qeadan (2010), in final review.
Why bother with the stochastic models? • Can be used to estimate probabilities or figure out properties of events not yet observed. • Incorporate the dependence between duration, magnitude and maximum of the events. • Represent the process in a mathematically natural way. • Can be extended to include the spatial dimension. • Can use them as framework for precise formulation of definitions, probabilities, etc., for natural events.
Magnitude=X=7.76 Maximum=Y= 1.04 EXAMPLE 1: THE “DUST BOWL” The great drought of the 1930s in the US, the 'Dust Bowl' impacted millions of people in many states. It had terrifying effects on the economy and the natural environment. Maximum=Y= 1.04 • Probability of a drought longer or larger than the 'Dust Bowl' is 0.08; • Probability of a drought longer and larger than 'Dust Bowl' is 0.06. • Conditional probability of a drought with at least 'Dust Bowl'’s magnitude given that duration is 11 years is 0.46
EXAMPLE 2: Paris heat wave of the 2003 In August 2003, France experienced an extreme heat wave, that resulted in an estimated 14,802 deaths*. Definition of a hot event: consecutive observations above the 33oC. • Probability of a hot event with the same duration of 11 days is 0.000075; • Conditional probability of a heat wave with at least that magnitude given that duration is 11 days is about 5.5e-4. • Probability of a heat wave longer than 6 days and larger than 100 (98th percentile of magnitudes) is 0.005. Max=64 Magnitude=479 N=11 days Zero level=330C Note: Maximum Y = 64deg C*10 (really 39.4oC) *Dhainaut et al. 2004.,Data from http://eca.knmi.nl/, station ID 104969
SUMMARY Given a process X1, X2, X3, …. fluctuating around a threshold. Positive events Suppose Xi’s are iid exp(β), and the process fluctuates according to a geometric model. threshold Negative events NEW stochastic model for the joint distribution of duration, magnitude, and maximum of the events.
NEVADA – A STATE OF EXTREMES Thank You