Download
1 / 1
10 likes | 95 Views
CATG. CATG. CATG. CATG. CATG. CATG. CATG. SAGE

E N D
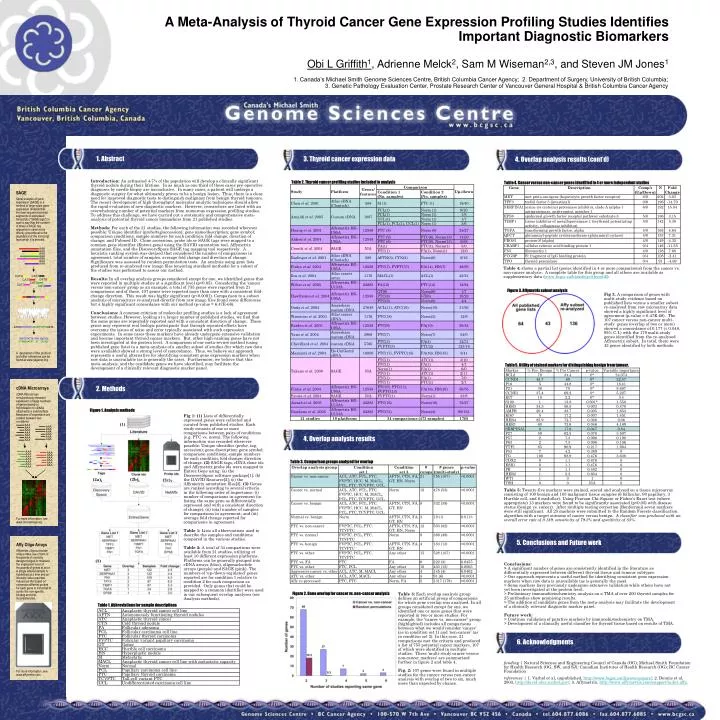
CATG CATG CATG CATG CATG CATG CATG SAGE Serial analysis of gene expression (SAGE) is a method of large-scale gene expression analysis.that involves sequencing small segments of expressed transcripts ("SAGE tags") in such a way that the number of times a SAGE tag sequence is observed is directly proportional to the abundance of the transcript from which it is derived. A description of the protocol and other references can be found at www.sagenet.org. AAA AAA AAA AAA AAA AAA AAA AAA AAA AAA AAA AAA AAA …CATGGATCGTATTAATATTCTTAACATG… GATCGTATTA 1843 Eig71Ed TTAAGAATAT 33 CG7224 cDNA Microarrays cDNA Microarrays simultaneously measure expression of large numbers of genes based on hybridization to cDNAs attached to a solid surface. Measures of expression are relative between two conditions. For more information, see www.microarrays.org. AAA AAA AAA AAA AAA AAA AAA AAA AAA AAA AAA AAA AAA AAA AAA AAA AAA AAA AAA AAA Affy Oligo Arrays Affymetrix oligonucleotide arrays make use of tens of thousands of carefully designed oligos to measure the expression level of thousands of genes at once. A single labeled sample is hybridized at a time and an intensity value reported. Values are the based on numerous different probes for each gene or transcript to control for non-specific binding and chip inconsistencies. A Meta-Analysis of Thyroid Cancer Gene Expression Profiling Studies Identifies Important Diagnostic Biomarkers Obi L Griffith1, Adrienne Melck2, Sam M Wiseman2,3, and Steven JM Jones1 1. Canada’s Michael Smith Genome Sciences Centre, British Columbia Cancer Agency; 2. Department of Surgery, University of British Columbia; 3. Genetic Pathology Evaluation Center, Prostate Research Center of Vancouver General Hospital & British Columbia Cancer Agency 1. Abstract 3. Thyroid cancer expression data 4. Overlap analysis results (cont’d) Introduction: An estimated 4-7% of the population will develop a clinically significant thyroid nodule during their lifetime. In as much as one third of these cases pre-operative diagnoses by needle biopsy are inconclusive. In many cases, a patient will undergo a diagnostic surgery for what ultimately proves to be a benign lesion. Thus, there is a clear need for improved diagnostic tests to distinguish malignant from benign thyroid tumours. The recent development of high throughput molecular analytic techniques should allow the rapid evaluation of new diagnostic markers. However, researchers are faced with an overwhelming number of potential markers from numerous expression profiling studies. To address this challenge, we have carried out a systematic and comprehensive meta-analysis of potential thyroid cancer biomarkers from 21 published studies. Methods: For each of the 21 studies, the following information was recorded wherever possible: Unique identifier (probe/tag/accession); gene name/description; gene symbol; comparison conditions; sample numbers for each condition; fold change; direction of change; and Pubmed ID. Clone accessions, probe ids or SAGE tags were mapped to a common gene identifier (Entrez gene) using the DAVID annotation tool, Affymetrix annotation files, and the DiscoverySpace SAGE tag mapping tool respectively. A heuristic ranking system was devised that considered the number of comparisons in agreement, total number of samples, average fold change and direction of change. Significance was assessed by random permutation tests. An analysis using gene lists produced from re-analyzed raw image files (ensuring standard methods) for a subset of the studies was performed to assess our method. Results: In all overlap analysis groups considered except for one, we identified genes that were reported in multiple studies at a significant level (p<0.05). Considering the ‘cancer versus non-cancer’ group as an example, a total of 755 genes were reported from 21 comparisons and of these, 107 genes were reported more than once with a consistent fold-change direction. This result was highly significant (p<0.0001). Comparison to a subset analysis of microarrays re-analyzed directly from raw image files found some differences but a highly significant concordance with our method (p-value = 6.47E-68). Conclusions: A common criticism of molecular profiling studies is a lack of agreement between studies. However, looking at a larger number of published studies, we find that the same genes are repeatedly reported and with a consistent direction of change. These genes may represent real biologic participants that through repeated efforts have overcome the issues of noise and error typically associated with such expression experiments. In some cases these markers have already undergone extensive validation and become important thyroid cancer markers. But, other high-ranking genes have not been investigated at the protein level. A comparison of our meta-review method (using published gene lists) to a meta-analysis of a smaller subset of studies (for which raw data were available) showed a strong level of concordance. Thus, we believe our approach represents a useful alternative for identifying consistent gene expression markers when raw data is unavailable (as is generally the case). Furthermore, we believe that this meta-analysis, and the candidate genes we have identified, may facilitate the development of a clinically relevant diagnostic marker panel. Table 2. Thyroid cancer profiling studies included in analysis Table 4. Cancer versus non-cancer genes identified in 4 or more independent studies Table 4: shows a partial list (genes identified in 4 or more comparisons) from the cancer vs. non-cancer analysis. A complete table for this group and all others are available as supplementary data (www.bcgsc.ca/bioinfo/ge/thyroid/). Figure 3. Affymetrix subset analysis Fig 3. A comparison of genes with multi-study evidence based on published lists versus a smaller subset re-analysed from raw microarray data showed a highly significant level of agreement (p-value = 6.47E-68). The 107 cancer versus non-cancer multi-study genes (overlap of two or more) showed a concordance of 0.177 (± 0.048, 95% C.I.) with the 179 multi-study genes identified from the re-analysed Affymetrix subset. In total, there were 43 genes identified by both methods. Table 5. Utility of stained markers for distinguishing benign from tumour. 2. Methods Figure 1. Analysis methods Fig 1: (1) Lists of differentially expressed genes were collected and curated from published studies. Each study consists of one or more comparisons between pairs of conditions (e.g. PTC vs. norm). The following information was recorded wherever possible: Unique identifier (probe, tag, accession); gene description; gene symbol; comparison conditions; sample numbers for each condition; fold change; direction of change. (2) SAGE tags, cDNA clone ids and Affymetrix probe ids were mapped to Entrez Gene using: (a) the DiscoverySpace software package[1]; (b) the DAVID Resource[2]; (c) the Affymetrix annotation files[3]. (3)Genes are ranked according to several criteria in the following order of importance: (i) number of comparisons in agreement (ie. listing the same gene as differentially expressed and with a consistent direction of change); (ii) total number of samples for comparisons in agreement; and (iii) average fold change reported for comparisons in agreement. Table 1: Lists all abbreviations used to describe the samples and conditions compared in the various studies. Table 2: A total of 34 comparisons were available from 21 studies, utilizing at least 10 different expression platforms. Platforms can be generally grouped into cDNA arrays (blue), oligonucleotide arrays (purple) and SAGE (pink). The numbers of ‘up-/down-regulated’ genes reported are for condition 1 relative to condition 2 for each comparison as provided. Only genes that could be mapped to a common identifier were used in our subsequent overlap analyses (see Analysis methods). (1) 4. Overlap analysis results 9 Table 3. Comparison groups analyzed for overlap (2b) (2a) (2c) Table 5: Twenty-five markers were stained, scored and analyzed on a tissue microarray consisting of 100 benign and 105 malignant tissue samples (6 follicular, 90 papillary, 3 Hurthle cell, and 6 medullar). Using Pearson Chi-Square or Fisher’s Exact test (where appropriate) 13 markers were found to be significantly associated (p<0.05) with disease status (benign vs. cancer). After multiple testing correction (Bonferroni) seven markers were still significant. All 25 markers were submitted to the Random Forests classification algorithm with a target outcome of cancer versus benign. A classifier was produced with an overall error rate of 0.189, sensitivity of 79.2% and specificity of 83%. 5. Conclusions and Future work (3) Conclusions: > A significant number of genes are consistently identified in the literature as differentially expressed between different thyroid tissue and tumour subtypes. > Our approach represents a useful method for identifying consistent gene expression markers when raw data is unavailable (as is generally the case). > Some markers have previously undergone extensive validation while others have not yet been investigated at the protein level. > Preliminary immunohistochemistry analysis on a TMA of over 200 thyroid samples for 25 antibodies show promising results. > The addition of candidate genes from the meta-analysis may facilitate the development of a clinically relevant diagnostic marker panel. Future work: > Continue validation of putative markers by immunohistochemistry on TMA. > Development of a clinically useful classifier for thyroid tissue based on results of TMA. Figure 2. Gene overlap for cancer vs. non-cancer analysis Table 3: Each overlap analysis group defines an artificial group of comparisons for which gene overlap was analyzed. In all groups considered except for one, we identified one or more genes that were reported in two or more studies. For example, the “cancer vs. non-cancer” group (highlighted) includes all comparisons between what we would consider ‘cancer’ (as in condition set 1) and ‘non-cancer’ (as in condition set 2). In this case, 21 comparisons met the criteria and produced a list of 755 potential cancer markers, 107 of which were identified in multiple studies. These ‘multi-study cancer versus non-cancer markers’ are summarized further in figure 2 and table 4. Fig. 2: 107 genes were found in multiple studies for the cancer versus non-cancer analysis with overlap of two to six, much more than expected by chance. Table 1. Abbreviations for sample descriptions 6. Acknowledgments funding | Natural Sciences and Engineering Council of Canada (OG); Michael Smith Foundation for Health Research (OG, SW, and SJ); Canadian Institutes of Health Research (OG); BC Cancer Foundation references | 1. Varhol et al, unpublished, http://www.bcgsc.ca/discoveryspace/; 2. Dennis et al. 2003, http://david.abcc.ncifcrf.gov/; 3. Affymetrix, http://www.affymetrix.com/support/index.affx. For more information, see www.affymetrix.com.


![Statistics [1/2,3/2]](https://cdn2.slideserve.com/4297614/statistics-1-2-3-2-dt.jpg)