Download
1 / 23
230 likes | 375 Views
TOGA Pan-Pacific Surface Current Study. NOAA Atlantic Oceanographic and Meteorological Laboratory (AOML) 25-26 April 1988 Miami, Florida. Background: WOCE and TOGA.

E N D
TOGA Pan-Pacific Surface Current Study NOAA Atlantic Oceanographic and Meteorological Laboratory (AOML) 25-26 April 1988 Miami, Florida
Background: WOCE and TOGA • In the late ‘80s, both TOGA and the World Ocean Circulation Experiment (WOCE) were incorporating drifters as part of their programs. • Since the programs were bound to overlap, it would be cost-effective to coordinate their strategies. • In April 1988, the WOCE Planning Committee and all Principal Investigators of the TOGA Pan-Pacific Surface Current study met at AOML/NOAA in Miami, Florida.
Proposed Plan • Deploy 450 drifters over 2 years • Spatial coverage: 15N-15S, 80W-126E • Desired sampling density: 2 deg. latitude by 10 deg. longitude
Some specific questions • What are the causes of SST warming? Why, in some years, does cold water fail to surface in the eastern tropical Pacific from September to January?
Competing Hypotheses: • SST variations are caused by surface heat advection. Warming events occur when normal surface circulation patterns are disrupted. • SST variations are driven by local air-sea interactions. Warming events occur when vertical mixing in a region is reduced, and colder, deeper waters cannot be brought to the surface.
Which hypothesis is correct? • How can they be tested using drifter data?
The surface advection hypothesis Flow component parallel to T gradient advects heat.
Actual flow in the region is in opposite direction to geostrophic flow. • The accuracy of the ship-drift derived flow is unknown. • Not enough data at the time to compute the heat advection during the warming episodes.
Time-varying flow component also advects significant amount of heat. • Higher frequency and smaller spatial scales than the mean flow. • Again, direct measurements needed to fully resolve the head advection.
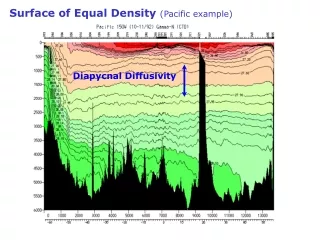
The vertical mixing hypothesis • Look at heat content of very near-surface layer of depth h. • Newell (1986) hypothesizes that warming events happen when, over a monthly time scale, net surface heat flux approaches 0, average temperature over h is close to constant, and turbulent flux at base of the layer is significantly reduced from its normal value. • Accurate measurements of daily temperature change following the water are needed the temporal and spatial turbulent flux variability.
Additional objectives: Regional circulation studies • Testing the competing heat advection hypotheses requires a pan-Pacific data set. • Same data can be used to study local phenomena. • To address the potential issues in detail, the plan divides the Pacific basin into 3 parts: eastern, central and western.
Eastern Pacific • Heat advection in the “Cold Tongue” • Why does the Cold Tongue fail to develop during El Nino events? • Equatorial divergence • Develop a time series of estimates of Ekman transport divergence near the equator. • Shear-instability of waves • Shear instability between equatorial currents generates cusp-shaped waves that lead to an equatorially-convergent heat transport. • Drifters can detect the presence or absence of these waves. • Eastern Pacific warm pool • Shallower and more variable than the Western Pacific Warm Pool. • Generation region for eastern Pacific hurricanes.
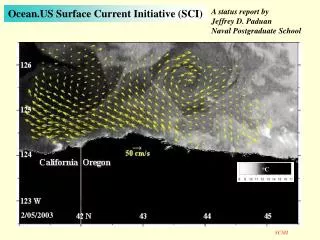
Central Pacific • SST anomalies during ENSO events • Can they be observed in the central Pacific? • Equatorial mixing • No data on horizontal eddy energy in central tropical Pacific • Provide direct measurements to verify model results • Wind-driven currents • Subtracting geostrophic flow from drifter-measured actual flow produces estimates of wind-driven component.
Western Pacific • Large-scale circulation • multiple current systems with large seasonal and interannual variations • Historical ship drift data is insufficient to resolve the temporal variations and mesoscale spatial features. Drifters provide better resolution. • Cross-equatorial flow • What are the seasonal patterns? Where does the flow in the New Guinea Current and SECC go? Is there a mean flow across the equator in the West? • Western Pacific Warm Pool • Present (as of 1988) techniques only reserved the temperature structure in the pool to within 0.7o C. TOGA requirements are within 0.3o C. • Westerly wind bursts and eastward jets • How far east do these jets carry Western water? What is the equatorial convergence in the surface layer in these jets.
Drifter design and calibration • Two drogue designs to be assesseed during calibration stage. • Test survivability and water-following characteristics. • Determine which type of drifter will be used for the program in the 90s.
Deployment strategy • Area of interest: 15oS-15oN, 80oW-126oE • Area is divided into approx. 230 2o x 10o boxes • Objective: build an array of drifters over 2 years • Minimum # of drifters: 230; conservative maximum: 450 • Common drifter lifetime: 9months-1year • Start with 50-60 deployments a month, work to desired density. • Australia, France and Japan also involved in contributing drifters.
Ship of opportunity tracks available for drifter deployment.
Data management • Main data center at AOML/NOAA in Miami • Raw ARGOS data sampled daily. Maps based on weekly drifts will be regularly distributed to participants. • Monthly data reported to Climate Analysis Bulletin and made available to all countries participating in TOGA. http://www.aoml.noaa.gov/phod/dac/gdp.html
Discussion Questions • Which of the two competing hypotheses for SST variability do you think is right? What other technologies developed over the past 20 years would you use to test them? • In addition to the pan-Pacific and regional studies listed in the plan, what other purposes would the drifter data be useful (or has been useful for)? • Before the plan was formed, there was strong debate about 15m vs. 100m drogue depth for the drifters. Why did the 15m drogue win? What are the advantages and disadvantages of the shallower drogue?