Download
1 / 51
510 likes | 630 Views
Empirical evaluation of prediction- and correlation network methods applied to genomic data. Steve Horvath University of California, Los Angeles. Content. Review of weighted correlation network analysis ( WGCNA ) When Is Hub Gene Selection Better than Standard Meta-Analysis?

E N D
Empirical evaluation of prediction- and correlation network methods applied to genomic data Steve Horvath University of California, Los Angeles
Content Review of weighted correlation network analysis (WGCNA) When Is Hub Gene Selection Better than Standard Meta-Analysis? Evaluating systems biologic gene selection methods The epigenetic clock: a highly accurate genomic predictor of age
Construct a network Rationale: make use of interaction patterns between genes Identify modules Rationale: module (pathway) based analysis Relate modules to external information Array Information: Clinical data, SNPs, proteomics Gene Information: gene ontology, EASE, IPA Rationale: find biologically interesting modules • Study Module Preservation across different data • Rationale: • Same data: to check robustness of module definition • Different data: to find interesting modules. Find the key drivers in interesting modules Tools: intramodular connectivity, causality testing Rationale: experimental validation, therapeutics, biomarkers
Weighted correlation networks are valuable for a biologically meaningful… • reduction of high dimensional data • expression: microarray, RNA-seq • gene methylation data, fMRI data, etc. • integration of multiscale data • expression data from multiple tissues • SNPs (module QTL analysis) • Complex phenotypes
An anatomically comprehensive atlas ofthe adult human brain transcriptome MJ Hawrylycz, E Lein,..,AR Jones (2012) Nature 489, 391-399 Allen Brain Institute
Data • Brains from two healthy males (ages 24 and 39) • 170 brain structures • over 900 microarray samples per individual • 64K Agilent microarray • This data set provides a neuroanatomically precise, genome-wide map of transcript distributions
Modules in brain 1 Global gene networks.
How to construct a weighted correlation network?Systems biology as a field of study: interactions between the components of biological systems
Network=Adjacency Matrix • A network can be represented by an adjacency matrix, A=[aij], that encodes whether/how a pair of nodes is connected. • A is a symmetric matrix with entries in [0,1] • For unweighted network, entries are 1 or 0 depending on whether or not 2 nodes are adjacent (connected) • For weighted networks, the adjacency matrix reports the connection strength between node pairs • Our convention: diagonal elements of A are all 1.
Two types of weighted correlation networks Default values: β=6 for unsigned and β=12 for signed networks. We prefer signed networks… Zhang et al SAGMB Vol. 4: No. 1, Article 17.
Adjacency versus correlation in unsigned and signed networks Unsigned Network Signed Network
Advantages of soft thresholding with the power function • Robustness: Network results are highly robust with respect to the choice of the power β (Zhang et al 2005) • Calibration of different networks becomes straightforward, which facilitates consensus module analysis • Module preservation statistics are particularly sensitive for measuring connectivity preservation in weighted networks • Math reason: Geometric Interpretation of Gene Co-Expression Network Analysis. PloS Computational Biology. 4(8): e1000117
How to detect network modules?Systems biology as aparadigm, usually defined in antithesis to the so-called reductionist paradigm (biological organization)
Module Definition • Based on the resulting cluster tree, we define modules as branches • Modules are either labeled by integers (1,2,3…) or equivalently by colors (turquoise, blue, brown, etc) • We often use average linkage hierarchical clustering coupled with the topological overlap dissimilarity measure. • Next we use the dynamic tree cutting method to define clusters. Langfelder et al 2007
Defining modules based on a hierarchical cluster tree Langfelder P, Zhang B et al (2007) Defining clusters from a hierarchical cluster tree: the Dynamic Tree Cut library for R. Bioinformatics 2008 24(5):719-720 Module=branch of a cluster tree Dynamic hybrid branch cutting method combines advantages of hierarchical clustering and pam clustering
How does one find “consensus” modules based on multiple gene expression data (networks)?
Example: Multiple Human brain expression data sets from Huntington's DiseasePublicly available caudate nucleus gene expression data from HD subjects and controls1) Durrenbergeret al (2012). Selection of novel reference genes for use in the human central nervous system: a BrainNet Europe Study. ActaNeuropathol. 2012 Dec;124(6):893-9032) Hodges et al Luthi-Carter (2006) Regional and cellular gene expression changes in human Huntington’s disease brain. Human Molecular Genetics, 2006, Vol. 15, No. 6
Analysis steps of WGCNA • Construct a signed weighted correlation network • based on 2 human gene expression data sets • Purpose: keep track of co-expression relationships 2. Identify consensus modules Purpose: find robustly defined and reproducible modules Technique: Consensus adjacency is a quantile of the input e.g. minimum, lower quartile, median 3. Relate modules to external information HD disease status Gene Information: gene ontology, cell marker genes Purpose: find biologically meaningful modules
Consensus dendrogram with module colors and meta-analysis significance for diagnosis. The colors correspond to the meta-analysis Z score (with weights proportional to root of number of DOF); blue color denotes genes are down in HD vs controls, and red color denotes genes that are up in HD vs controls.
Question: How does one summarize the expression profiles in a module?Answer: This has been solved.Math answer: module eigengene= first principal componentNetwork answer: the most highly connected intramodular hub geneBoth turn out to be equivalent
Module Eigengene= measure of over-expression=average redness Rows,=genes, Columns=microarray The brown module eigengenes across samples
Module eigengenes are very useful • 1) They allow one to relate modules to each other • Allows one to determine whether modules should be merged • 2) They allow one to relate modules to clinical traits (HD status) and genetic variation (e.g. CAG tri-nucleotide repeat length) -> avoids multiple comparison problem • 3) They allow one to define a measure of module membership: kME=cor(x,ME) • Can be used for finding centrally located hub genes • Can be used to define gene lists for GO enrichment
Content When Is Hub Gene Selection Better than Standard Meta-Analysis? Evaluating systems biologic gene selection methods
When does hub gene selection lead to more meaningful gene lists than a standard statistical analysis based on significance testing? • Here we address this question for the special case when multiple data sets are available. • This is of great practical importance since for many research questions multiple gene expression or other -omics data sets are publicly available. • In this case, the data analyst can decide between a standard statistical approach (e.g., based on meta-analysis) and a co-expression network analysis approach that selects intramodular hubs in consensus modules.
Intramodular hub genes versus whole network hubs • Intramodular hubs have high intramodular connectivity kME with respect to a given module of interest • Whole network hubs have high values of whole network connectivity k • k= row sum of the adjacency matrix • k= number of direct neighbors in case of an unweighted network
Q & A • 1. Are whole-network hub genes relevant or should one exclusively focus on intramodular hubs? • Answer: Focus exclusively on intramodularhubs in trait-related modules. • 2. Do network-based gene selection strategies lead to gene lists that are biologically more informative than those based on a standard marginal approaches? • Answer: Yes, gene selection based on intramodular connectivity leads to biologically more informative gene lists than marginal approaches. • 3. Do network-based gene selection strategies lead to gene lists that have more reproducible trait associations than those based on a standard marginal approaches? Answer: Overall no. But in case of a weak signal networks can help.
Criteria for judging gene selection methods • Criterion 1evaluates the biological insights gained, i.e. it is relevant in basic research. • Criterion 2 evaluates the validation success in independent data sets, i.e. it is relevant when it comes to developing diagnostic or prognostic biomarkers.
Data sets used in the empirical evaluation • We compare standard meta-analysis with consensus network analysis in three comprehensive and unbiased empirical studies: • (1) Find genes predictive of lung cancer survival • Gold standard=cell proliferation related genes • (2) Find age related DNA methylation markers • Gold standard= Polycomb group target genes • (3) Find genes related to total cholesterol in mouse liver tissues • Gold standard= immune system related genes
R code in the WGCNA package • For standard screening, we used the metaAnalysis function • For finding hubs in consensus modules, we used the consensusKME function
Results • The results demonstrate that intramodular hub gene status is more useful than a meta-analysis p-value when identifying biologically meaningful gene lists (reflecting criterion 1). • However, meta-analysis methods perform as good as (if not better) than a co-expression network approach in terms of validation success (criterion 2).
Here a biological aging clock • is defined as a method for predicting the age (in years) of a subject/biological sample • Examples • based on telomere length • based on gene expression levels • based on protein expression levels • DNA methylation levels
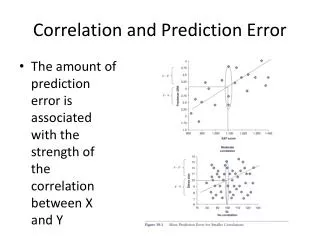
Telomere length versus age in white blood cells • Relation between age and TRFin men (r=−0.45) and in women (r=−0.48) Benetos A, et al (2001) Telomere Length as an Indicator of Biological Aging: The Gender Effect and Relation With Pulse Pressure and Pulse Wave Velocity Hypertension. 2001
CDKN2A=p16Ink4A=tumor suppressor • tumor suppressor protein encoded by the CDKN2Agene • Cyclin-dependent kinase inhibitor 2A, (CDKN2A, p16Ink4A) • also known as multiple tumor suppressor 1 (MTS-1) • p16plays an important role in regulating the cell cycle, and mutations in p16 increase the risk of developing a variety of cancers, notably melanoma. • Increased expression of the p16 gene as organisms age reduces the proliferation of stem cells. • This reduction in the division and production of stem cells protects against cancer while increasing the risks associated with cellular senescence.
p16INK4a clock • R^2=0.40 means that the age correlation is 0.63 • Liu Y et al (May 2009). "Expression of p16INK4a in peripheral blood T-cells is a biomarker of human aging". Aging Cell 8 (4): 439–48.
Disruptive clock technology based on DNA methylation levels • State of the art of biological clock before epigenetic markers • Gene products (mRNA, protein levels) lead to an age correlation = 0.63 • DNA methylation levels (epigenetics) can be used to define drastically more accurate clocks • Epigenetic clock leads to an age correlation = 0.96
DNA methylation age of human tissues and cell types. Genome Biol. 2013 14(10):R115PMID: 24138928
Illumina data sets • The first 39 data sets were used to construct ("train") the age predictor. • Data sets 40-71 were used to test (validate) the age predictor. • Data sets 72-82 served other purposes e.g. to estimate the DNAm age of embryonic stem and iPS cells. • Training data were chosen i) to represent a wide spectrum of tissues/cell types, ii) to involve samples whose mean age (43 years) is similar to that in the test data, and iii) to involve a high proportion of samples (37%) measured on the Illumina450K platform since many on-going studies use this recent Illumina platform. • Only studied 21369 CpGs (measured with the Infinium type II assay) which were present on both Illumina platforms (Infinium450K and 27K) and had fewer than 10 missing values across the data sets.
Age predictor • To ensure an unbiased validation in the test data, only used the training data to define the age predictor. • A transformed version of chronological age was regressed on the CpGs using a penalized regression model (elastic net). • The elastic net regression model automatically selected 353 CpGs. • I refer to the 353 CpGs as (epigenetic) clock CpGs since their weighted average (formed by the regression coefficients) amounts to an epigenetic clock.
Results send to me via email Blood data from Marco Boks Jan 2014 Blood data Jim Pankow, Jan 2014 Median error=3.5 years
Aging clock applied to urine • This figure, created by Wei Guo from ZymoResearch, • Median error=2.7 years, • Cor=0.98