Download
1 / 44
440 likes | 661 Views
Retrieval of forest structural characteristics from lidar waveforms : new applications and methods. Ph.D. Dissertation Defense by Svetlana Y. Kotchenova. Dissertation Committee Anthony B. Davis Yuri Knyazikhin Ranga B. Myneni Nathan Phillips Curtis Woodcock. October 4 th , 2004.

E N D
Retrieval of forest structural characteristics from lidar waveforms:new applications and methods Ph.D. Dissertation Defense by Svetlana Y. Kotchenova Dissertation Committee Anthony B. Davis Yuri Knyazikhin Ranga B. Myneni Nathan Phillips Curtis Woodcock October 4th, 2004 Geography Department, Boston University
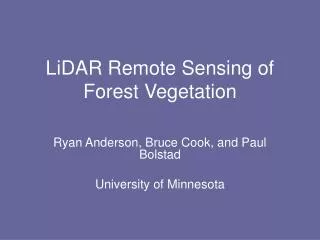
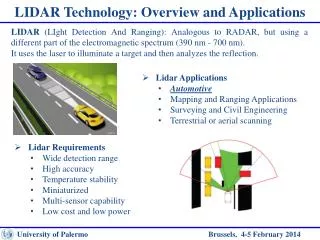
Large-footprint waveform-recording laser altimeters: - SLICER (air-borne) - LVIS (air-borne) - GLAS (space-borne) Lidar = light detection and ranging Data products: - Canopy height - Vertical canopy structure (vertical distribution of nadir- intercepted surfaces) - Ground elevation http://www.geog.umd.edu/vcl Lidar remote sensing technique 8 km 1 km Lidar waveform Lidar footprint 2
swath width flight path http://denali.gsfc.nasa.gov/research/laser/slicer/slicer.html telescope FOV SLICER (Scanning Lidar Imager of Canopies by Echo Recovery) Data • Technical characteristics • Status previously-used • Platform air-borne • Wavelength 1064 nm • Pulse frequency 80 Hz • Pulse width 4 ns • Pulse form Raleigh • Footprint diameter 9-10 m • Transmit energy 0.7 mJ • Southern BOREAS study area, Saskatchewan, Canada. July 20-30, 1996 Black spruce Jack pine • Smithsonian Environmental Research Center. Western shore of Chesapeake Bay, eastern Maryland.September 7, 1995. Footprint distribution pattern Mixed deciduous forest stands with the overstory dominated bytulip poplar 3
flight path . . . . . . . . . . . . . . . . . . . . . . . . . . 27 m . . . . . . 9 m 25 m 80 footprints LVIS (Laser Vegetation Imaging Sensor) Footprint distribution pattern • Technical characteristics • (advanced version of SLICER) • Status currently-used • Platform air-borne • Wavelength 1064 nm • Pulse frequency 500 Hz (320 Hz) • Pulse width 10 ns • Pulse form Gaussian • Footprint diameter 1-80 m (25 m) • Transmit energy 5 mJ Data La Selva Biological Research Station, Costa Rica. March, 1998. (A 1546-ha area comprised of primary (73%) and secondary tropical rainforests and agroforestry plots.) Harvard Forest, Massachusetts, USA. Summer 1999, summer 2003. Temperate deciduous broadleaf forest, dominant species include white pine, hemlock, spruce, oak, and maple. 4
GLAS (Geoscience Laser Altimeter System) http://icesat.gsfc.nasa.gov GLAS will provide continuous global measurements of the Earth’s land surface topography. • Technical characteristics • Status launched Jan. 2003 • Platform space-borne • Wavelength 1064 nm (vegetation) • Pulse frequency 40 Hz • Pulse width 5 ns • Pulse form Gaussian • Footprint diameter 60-70 m • Transmit energy 5 mJ • Along-track separation 170 m • Cross-track max 15 km • Cross-track min 2.5 km • Repeat cycle 183 days • Life-time 3 years 5
Current applications of lidar measurements (1) 1. Retrieval of canopy height profiles (CHP), or the distributions of canopy material with height Assumptions: 1) Uniform horizontal distribution of leaves 2) Absence of multiple scattering 3) Negligible influence of non-foliated surfaces 6
Calculation of special indices(mean, medium, quadratic mean height) Ground measurements to relate height indices and biomass Regression procedure Canopy height&CHP Lidar recorded waveform Biomass, basal area, quadratic mean stem diameter Current applications of lidar measurements (2) 2. Biomass estimation 3. Other methods - Canopy volume method (vegetation is treated as a number of 3-dim pixels, each of which is defined as containing canopy or not) - Calculation of mean transmittance profiles (rate of attenuation, whole canopy transmittance, radiation effective height) 7
Assumption of uniform horizontal distribution of leaves Foliage clumping is ignored The method is not applicable for coniferous forests 1. Erroneous assignment of larger amounts of foliage to the lower part of the waveform Critical for photosynthesis and light transmission studies 2. Assumption of single scattering The method is hardly applicable to GLAS data Requirement of extensive ground measurements (DBH of each tree within the footprint area, 25-30 footprint areas at least) Shortcomings of the existing methods Retrieval of canopy height profiles * * Biomass estimation Current applications * Numerous other applications are possible but have not been explored yet. 8
1.Evaluation of the contribution of multiple scattering 2.Development of a new application for lidar data 3.Improvement of the current algorithm for retrieval of CHPs 4. Development of a new algorithm for biomass estimation Research plan * * * 9
Task 1: Contribution of multiple scattering a) Development of time-dependent stochastic radiative transfer theory to describe the radiation regime in heterogeneous vegetation canopies b) Creation of a physical model describing the propagation of lidar signals through vegetation on the basis of this theory c) Validation of the model with field data d) Evaluation of multiple scattering contribution through the comparison of reflected signals formed with and without multiple scattering 10
Multiply scattered photons appear delayed in the waveform compared to singly scattered photons 0 Expected results: Enhancement of the lower part of the reflected signal H z Time-dependent stochastic RT theory Boundary conditions: 11
Integration of the RT equation over the footprint area Probability function This function defines the probability of finding foliage elements in a horizontal plane at depth z. Description of canopy structure Indicator function: Conditional probability function This function defines the probability that one finds a vegetated element at point , moving from point along direction , given that there is a vegetated element at . 12
Model inputs (1) Characteristicsof incoming radiation (direction, intensity and pulse duration) (2) Canopy structural parameters (tree height, crown length, leaf area density, leaf normal orientation distribution, and statistical probability functions p and K) (3) Optical properties of leaves and soils Model outputs (1) The mean intensity of radiation over a horizontal plane at depth z (2) The mean intensity of radiation over a vegetated area at depth z Time-dependent stochastic RT model The integrated RT equation is solved numerically with the SOSA method (successive orders of scattering approximations): ,where , is the mean intensity of photons scattered k times. 13
Averaged SLICER waveforms Model-simulated waveforms SOBS forest Southern Old Black Spruce • age 100-155 years • height 10-11 m • LAI 4.0 • location BOREAS Mature-aged forest Tulip poplar association • age 99 years • height 32-37 m • LAI 5.16 • location Maryland Model simulations for different types of forests 14
Averaged SLICER waveforms Model simulations: with multiple scattering without multiple scattering Simulations with and without multiple scattering • Southern BOREAS study area • SOJP (old jack pine)SOBS • age, years 60-75 100-155 • height, m 16-19 10-11 • LAI 2.61 4.0 • Eastern Maryland, Tulip poplar association • MatureIntermediate • age, years 99 41 • height, m 32-37 31-34 • LAI 5.16 5.26 15
Retrieval of canopy structural parameters Multiply scattered photons carry information on canopy structural parameters, namely, foliage density and gap fraction. Single interaction: ,where is the round trip time between the sensor and the interaction point Several interactions:, where is the extra time due to multiple scattering - photon mean free path - extinction coefficient - leaf area volume density 16
Task 1: Conclusions 1. The inclusion of multiple scattering leads to a better approximation ofthe return signal. 2. Multiply scattered photons magnify the signal and significantly enhance the lower part of it. 3. In case of sparse canopies, effects of multiple scattering are insignificant and single-scattering approximation models are expected to provide good simulations of lidar-recorded signals. 4. Multiply scattered photons carry information on canopy structural parameters S. Y. Kotchenova, N. V. Shabanov, Y. Knyazikhin, A. B. Davis, R. Dubayah, and R. B. Myneni, Modeling lidar waveforms with time-dependent stochastic radiative transfer theory for remote estimations of forests structure. Journal of Geophysical Research, 108 (D15), 2003. 17
Task 2:New application for lidar measurements Canopy height profiles retrieved from lidar waveforms can be used for modeling gross primary productivity of deciduous forests 18
Gross Primary Production For several decades, monitoring and modeling the terrestrial carbon cycle have been among the main goals for many ecological and climate change studies. [NPP] = [GPP] – [Ra] Autotrophic respiration (the carbon lost by photo-respiration and by internal plant metabolism; about half of the total carbon uptake) Net Primary Production Gross Primary Production (the total amount of CO2 taken up by land plants from the atmosphere to participate in photosynthesis) - Annual terrestrial GPP is estimated as about 120 Pg/yr. - Forests cover about 26% of the total land surface area. Land surface: 148,300,000 km2 Forests: 38,700,000 km2 19
a) the big-leaf model b) the sunlit/shaded leaf separation model c) the multiple layer model d) the combined leaf-separation multiple-layer model Farquhar’s model Modeling photosynthesis for a unit leaf area scaling from leaf to canopy Overview of photosynthesis models 1) Production Efficiency Models (global and regional scales) GPP=g(T, soil moisture, VPD).FAPAR.PAR NPP=n(T, soil moisture, VPD).FAPAR.PAR (g and nare the light use efficiencies, T is the ambient temperature, VPD is the vapor pressure deficit, FAPAR is the fraction of absorbed Photosynthetically Active Radiation (PAR)) 2) Models based on Farquhar’s equations (global, regional and local scales) 20
Representation of the canopy as two big leaves with different illumination conditions Use of actual foliage profiles Division of the canopy into N layers with equal LAI + separation of sunlit and shaded leaves in each layer Advanced photosynthesis models Unit leaf area Farquhar’s model+ gs(RAD, T, VPD) Ph(RAD, T, CO2 , Ni, VPD, O2, wind) Lidar measurements Two-leaf model Combined two-leaf multiple-layer model 21
Drawbacks of the existing models 1. The two-leaf model (the leaf-separation model) Use of the average values of diffuse and direct PAR absorbed by the canopy. Fails to capture the attenuation of incident PAR with height. 2. The coupled model (the combined leaf-separation multiple-layer model) Assumption of a uniform distribution of foliage with height. Wrong sunlit/shaded leaf and PAR distributions except for the canopies with approximately uniform vertical structures of foliage. Will the accounting for the vertical distribution of foliage lead to a better estimation of photosynthesis? 22
Distributions of PAR, sunlit/shaded leaves, and GPP Comparison between the uniform and actual distributions of foliage 23
Model inputs Canopy structural parameters Characteristics of the incoming radiation Optical properties of leaves and soils • tree height • vertical foliage profiles • leaf inclination • direct PAR flux • diffuse PAR flux • solar zenith angle Model outputs • the distribution of direct PAR with height • the distribution of diffuse PAR with height Radiation model Reference - Shabanov et al., Stochastic modeling of radiation regime in discontinuous vegetation canopies. Remote Sensing of Environment. 74, 125-144, 2000. 24
Comparison (SLICER data collected over the mixed deciduous forest stands + environmental data) 2 1 3 different profiles & 1 month August, 1997 100 profiles & 3 days with different weather conditions Comparison of photosynthesis models Daily GPP rates calculated by the coupled model with uniform foliage profiles (the combined leaf-separation multiple-layer model) the two-leaf model (the sunlit/shaded leaf separation model) and will be compared with the GPP rates calculated by the coupled model with actual (lidar measured) foliage profiles 25
Daily GPP rates as functions of weather conditions (1) Measurements of incident PAR, temperature and humidity were taken at a 3-min time-step Wye Research and Education Center, Maryland, August 1997 http://uvb.nrel.colostate.edu/UVB/uvb_climate_network.html 26
- dailyGPP rates calculated by the two-leaf model CHP classification more than 80% of foliage in the first 2/3 of the tree more than 80% of foliage in the last 2/3 of the tree approximately uniform distribution of foliage remaining CHP Daily GPP rates as functions of weather conditions (2) GPP rates were calculated at a half-hour step and then integrated over a whole day-length period. Intermediate-aged stand Mature-aged stand 27
Daily GPP rates as functions of foliage profiles (1) SLICER waveforms(September 07, 1995) PAR, temperature, humidity(August 1997) Wye Research and Education Center, Maryland http://uvb.nrel.colostate.edu/UVB/uvb_climate_network.html Mean daily wind speed values (August 1997) Andrews AFB station, Maryland http://www.ncdc.noaa.gov/oa/climate/onlineprod/drought/xmgr.html 28
the two-leaf model the coupled model with uniform profiles the coupled model with actual profiles (For each day, the GPP rate was calculated at a half-hour step and then integrated over a whole day-length period.) Daily GPP rates as functions of foliage profiles (2) 3 different canopy profiles: (1) the majority of the foliage in the first half of the canopy (2) a nearly uniform distribution (3) the majority of the foliage in the lower part of the canopy 29
Task 2: Conclusions 1. The use of actual foliage profiles might lead to more accurate estimates of daily GPP rates in the photosynthesis models relying on the extrapolation of Farquhar’s equations from a unit leaf area to the whole canopy. 2. The disagreement range was almost the same for the two-leaf model and the coupled model with uniform CHPs during the comparison with the coupled model with actual CHPs. This means it might be useless to apply a multiple layer division in addition to the two-leaf separation if the actual foliage profile is not known. 3. An increase of the incident diffuse PAR due to the partial cloudiness could significantly enhance the daily carbon assimilation rate. The performed study also demonstrates the importance of separate measurements of diffuse and direct PAR. S. Y. Kotchenova, X. Song, N. V. Shabanov, C. S. Potter, Y. Knyazikhin, and R. B. Myneni, Lidar remote sensing for modeling gross primary production of deciduous forests. Remote Sensing of Environment, in Press. 30
Task 3:Improvement of the algorithm for retrieval of CHPs Drawbacks of the current algorithm: 1) the assumption of a uniform horizontal distribution of needles 2) ignoring the effects of multiple scattering 3) the use of canopy material distribution instead of foliage distribution * * 31
Shoots as basic structural elements 1. Use of shoots as basic structural elements instead of needles Description of the canopy structure in terms of spatial and angular distribution of shoots The shoot silhouette area to total area ratio: - the shoot silhouette area in direction ; - the total needle area of the shoot. The mean projection of unit shoot area: STAR depends on the shoot structure, shoot orientation and position in the crown. Reference – Stenberg, P. (1996). Simulations of the effects of shoot structure and orientation on vertical gradients in intercepted light by coniferous canopies. Tree Physiology, 16, 99-108. 32
Accounting for multiple scattering 2a. Scattering of radiation between the needles of a shoot (The scattering properties of needles are replaced with those of shoots) The shoot ( ) and needle ( ) scattering coefficients are related as where is the probability for a scattered photon to hit the same shoot again. Assumption: = constant Ray-tracing simulations: Reference – Smolander, S., & Stenberg, P. (2003). A method to account for shoot scale clumping in coniferous canopy reflectance models. Remote Sensing of Environment, 88(4), 363-373. 2b. Scattering of radiation between shoots (The RT model developed in Task 1 will be used to account for this type of scattering) 33
the current (M-H) algorithm The modified algorithm Step 1: accounting for scattering of radiation between the needles of a shoot ( ) Step 2: step 1 + accountingfor the shoot inclination Step 3: steps 1-2 + accounting for multiple scattering of radiation between the shoots Modification of the algorithm - the vegetation return at height z - the total vegetation return - the ground return 34
Conifer canopy models 1. The horizontal distribution of shoots is uniform; all layers are characterized, on average,by the same value – the standard simulation. mod 1 2. Shoots are uniformly distributed, but the mean increases from 0.1 to 0.25 with the degree of shading. The increase is modeled in two ways: a) as a linear function of a degree of shading: mod 2a b) as a quadratic function of the degree of shading exceeding 50% mod 2b 3. ... DS is calculated from the field measurements of PAR transmittance. Reference - W. Ni, X. Li, C. Woodcock, J.-L. Roujean, & R. E. Davis (1997). Transmission of solar radiation in boreal conifer forests: measurements and models. Journal of Geophysical Research, 102 (D24), 29555-29566. 35
the M-H algorithm The modifiedalgorithm mod 1 mod 2a mod 2b Retrieval of Canopy Height Profiles (1) SLICER data: the southern old black spruce site, BOREAS, Canada. July 1996. 36
Retrieval of Canopy Height Profiles (2) Field measurements of CAI: 1.87 Reference - J. M. Chen, P. M. Rich, S. T. Gower, J. M. Norman, & S. Plummer (1997). Leaf area index of boreal forests: Theory, techniques, and measurements. Journal of Geophysical Research, 102 (D24), 29429-29443. 37
Task 3: Conclusions 1. Clumping of needles into a shoot, shoots inclination and multiple scattering of radiation between the shoots are the only effects that can be taken into account without contradicting the basis of the M-H algorithm. 2. The main advantage of the modified algorithm is the use of the mathematically corrected approach for transferring from the distribution of needles to the distribution of shoots. S. Y. Kotchenova, N. V. Shabanov, Y. Knyazikhin, and R. B. Myneni (2004). Retrieval of canopy height profiles from lidar measurements over coniferous forests. IEEE Transactions on Geoscience and Remote Sensing, in Review. 38
Drawbacks of the current algorithm: Requirement of extensive ground measurements to relate canopy height profiles and biomass volumes (in particular, each tree diameter within a footprint should be measured). Case study 4.New algorithm for biomass estimation * Research plan for this study: A new algorithm is planned to be developed with the help of allometric scaling theory of plant energetics and geometry. 33
Assumptions: (1) the branch structure of a tree is considered a space-filling fractal system; (2) energy required to distribute resources is minimized. Results: the rate of fluid transport through this system scales as ¾ of the tree mass Reference – West et al. (1998). A general model for the origin of allometric scaling laws in biology. Science, 276, 122-126. - the max number of individuals that can be supported by unit area - the rate of resource supply per unit area - the average rate of resource use per individual - the average plant mass - the total plant mass Allometric scaling theory A general model for the structure and allometry of plant vascular systems Relationships between density and mass in resource-limited plants Reference – Enquist et al. (1998). Allometric scaling of plant energetics and population density. Nature, 305 (10), 163-165. 34
Application of the scaling model Problems: 1. Lidar instruments do not distinguish between foliage and woody material. How to extract foliage distribution from the retrieved CHP? 2. The general model for the structure and allometry of plant vascular systems is developed for an individual tree, while the lidar footprint seizes more than one tree. How to determine the number of trees within a footprint? Solutions: 1. Evaluation of the percentage of branch surface in the CHP using the structure and allometry general model. 2. Combination of the lidar technique with other remote sensing tools capable to capture the horizontal structure of vegetation. 35
Mapping of the horizontal structure of vegetation 1. Aerial photography It is one of the most widely used remote sensing tools in forestry. A large number of air photos are available. Reference – http://www.eoc.csiro.au 2. Polarimetric SAR Interferometry Reference - S. R. Cloude, D. Corr. Tree height retrieval using single baseline polarimetric interferometry. Proceedings of ESA Workshop, POLInSAR 2003, Frascati, Italy, 14-16 January. Scots Pine forest model Simulated SAR image 36
Conclusions - The proposed research will potentially make an important contribution into further development of lidar remote sensing technique. - The lack of lidar data is a significant obstacle of the developed program. 37
Thank you! Questions?.. 38