Download
1 / 47
470 likes | 605 Views
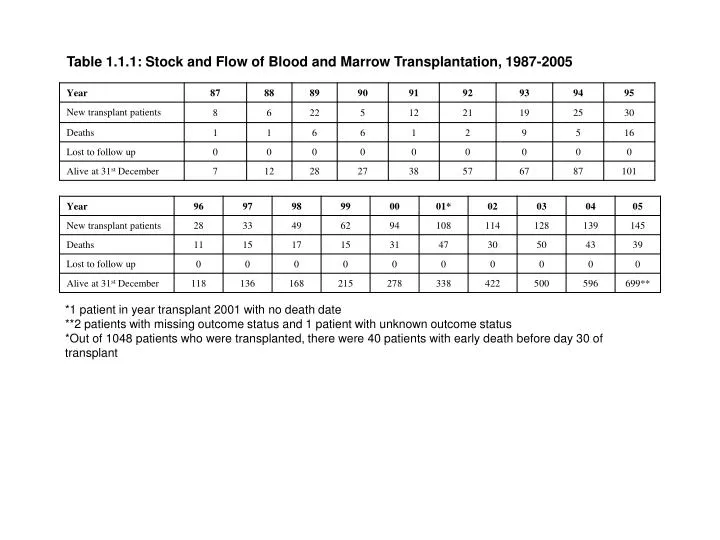
Table 1.1.1: Stock and Flow of Blood and Marrow Transplantation, 1987-2005. *1 patient in year transplant 2001 with no death date **2 patients with missing outcome status and 1 patient with unknown outcome status

E N D
Table 1.1.1: Stock and Flow of Blood and Marrow Transplantation, 1987-2005 *1 patient in year transplant 2001 with no death date **2 patients with missing outcome status and 1 patient with unknown outcome status *Out of 1048 patients who were transplanted, there were 40 patients with early death before day 30 of transplant
Figure 1.1.1: Stock and Flow of Blood and Marrow Transplantation, 1987-2005 New patients Alive at 31st Dec 700 600 500 400 Number of patients 300 200 100 0 1987 1989 1991 1993 1995 1997 1999 2001 2003 2005 1988 1990 1992 1994 1996 1998 2000 2002 2004 Year
Rate, pmp 6 5 4 New transplant rate, pmp 3 2 1 0 1987 1989 1991 1993 1995 1997 1999 2001 2003 2005 Year Table 1.1.2: New Transplant Rate per million population (pmp), 1987-2005 Figure 1.1.2: New Transplant Rate per million population (pmp), 1987-2005
Figure 1.1.3: Centre distribution (SDP), 1987-2005 KLA KLP UKM SJA UMA UMP 120 110 100 90 80 70 60 Number 50 40 30 20 10 0 1987 1989 1991 1993 1995 1997 1999 2001 2003 2005 Year
Figure 1.2.1: Gender distribution, 1987-2005 Male Female 100 80 60 Percent 40 20 0 1987 1989 1991 1993 1995 1997 1999 2001 2003 2005 Year
Figure 1.2.2: Ethnic group distribution, 1987-2005 Malay Chinese Indian Bumiputra Sarawak Others Bumiputra Sabah 100 90 80 70 60 Percent 50 40 30 20 10 0 1987 1989 1991 1993 1997 1999 2001 2003 2005 1995 Year
Table 1.2.3: Age distribution, 1987-2005 *Age=date of transplant – date of birth
0-9 years 10-19 years 20-39 years 40-59 years >=60 years 100 90 80 70 60 Percent 50 40 30 20 10 0 1987 1989 1991 1993 1995 1997 1999 2001 2003 2005 Year Figure 1.2.3: Age distribution, 1987-2005
Figure 1.3.1: Graft number, 1987-2005 Graft number 1 Graft number 2 Graft number 3 100 80 60 Percent 40 20 0 1987 1989 1991 1993 1995 1997 1999 2001 2003 2005 Year
Table 1.3.2: Type of transplant, 1987-2005 *6 patients with syngeneic type of transplant
Allogeneic + Syngeneic Autologous 140 120 100 80 Number 60 40 20 0 1987 1989 1991 1993 1995 1997 1999 2001 2003 2005 1988 1990 1992 1994 1996 1998 2000 2002 2004 Year Figure 1.3.2: Type of transplant, 1987-2005
Allogeneic + Syngeneic Autologous 280 260 240 220 200 180 160 Number 140 120 100 80 60 40 20 0 KLA UKM UMA GMC SJP KLP SJA UMP LWE Centre Figure 1.3.3: Type of transplant by Centre, 1987-2005
Figure 1.3.4: Transplant source, 1987-2005 Marrow PBSC/ Marrow+ PBSC Cord blood/ Marrow + cord 140 120 100 80 Number 60 40 20 0 1987 1989 1991 1993 1995 1997 1999 2001 2003 2005 Year
Table 1.3.5: HLA Match, 1987-2005 *excluding autologous
Table 1.3.6: Allogeneic Donor Relationship, 1987-2005 *excluding autologous, including syngeneic
Table 1.4.1: Cause of Death, 1987-2005 *3 patients with missing cause of death reported
1.00 0.75 0.50 Cumulative survival 0.25 0.00 0 1 2 3 4 5 6 7 8 9 10 11 12 13 14 15 16 17 18 19 20 Duration in years Year 1987-1992 Year 1993-1998 Year 1999-2005 Figure 1.4.1: Patient survival by year of transplant, 1987-2005
1.00 0.75 0.50 Cumulative survival 0.25 0.00 0 1 2 3 4 5 6 7 8 9 10 11 12 13 14 15 16 17 18 19 20 Duration in years Male Female Figure 1.4.2: Patient survival by gender, 1987-2005
1.00 0.75 0.50 Cumulative survival 0.25 0.00 0 1 2 3 4 5 6 7 8 9 10 11 12 13 14 15 16 17 18 19 20 Duration in years 0-9 years 10-19 years 20-39 years >=40 years Figure 1.4.3: Patient survival by age group, 1987-2005
0 1 2 3 4 5 6 7 8 9 10 11 Figure 1.4.4: Patient survival by type of transplant, 1987-2005 1.00 0.75 0.50 Cumulative survival 0.25 0.00 12 13 14 15 16 17 18 19 20 Duration in years Allogeneic + Syngeneic Autologous
1.00 0.75 0.50 Cumulative survival 0.25 0.00 0 1 2 3 4 5 6 7 8 9 10 11 12 13 14 15 16 17 18 19 20 Duration in years Allogeneic Autologous Figure 1.5.1: Disease-free survival for Acute Myeloid Leukaemia, 1987-2005 (Allogeneic vs. Autologous)
1.00 0.75 0.50 Cumulative survival 0.25 0.00 0 1 2 3 4 5 6 7 8 9 10 11 12 13 14 15 16 17 18 19 20 Duration in years Allogeneic Figure 1.5.2: Disease-free survival for Acute Lymphoblastic Leukaemia, 1987-2005 (Allogeneic)
1.00 0.75 0.50 Cumulative survival 0.25 0.00 0 1 2 3 4 5 6 7 8 9 10 11 12 13 14 15 16 17 18 19 20 Duration in years Allogeneic Figure 1.5.3: Disease-free survival for Thalassaemia, 1987-2005 (Allogeneic)
1.00 0.75 0.50 Cumulative survival 0.25 0.00 0 1 2 3 4 5 6 7 8 9 10 11 12 13 14 15 16 17 18 19 20 Duration in years Allogeneic Autologous Figure 1.5.4: Disease-free survival for Non-Hodgkin’s Lymphoma, 1987-2005 (Allogeneic vs. Autologous)
1.00 0.75 0.50 Cumulative survival 0.25 0.00 0 1 2 3 4 5 6 7 8 9 10 11 12 13 14 15 16 17 18 19 20 Duration in years Autologous Figure 1.5.5: Disease-free survival for Hodgkin’s Disease, 1987-2005 (Autologous)
1.00 0.75 0.50 Cumulative survival 0.25 0.00 0 1 2 3 4 5 6 7 8 9 10 11 12 13 14 15 16 17 18 19 20 Duration in years Allogeneic Figure 1.5.6: Disease-free survival for Chronic Myeloid Leukaemia, 1987-2005 (Allogeneic)
1.00 0.75 0.50 Cumulative survival 0.25 0.00 0 1 2 3 4 5 6 7 8 9 10 11 12 13 14 15 16 17 18 19 20 Duration in years Allogeneic Figure 1.5.7: Disease-free survival for Aplastic Anaemia, 1987-2005 (Allogeneic)
1.00 0.75 0.50 Cumulative survival 0.25 0.00 0 1 2 3 4 5 6 7 8 9 10 11 12 13 14 15 16 17 18 19 20 Duration in years Paediatric Adult Figure 1.5.8: Disease-free survival by age group for Acute Myeloid Leukaemia, 1987-2005 Paediatric is defined as age 18 years and adult age >18 years
1.00 0.75 0.50 Cumulative survival 0.25 0.00 0 1 2 3 4 5 6 7 8 9 10 11 12 13 14 15 16 17 18 19 20 Duration in years Paediatric Adult Figure 1.5.9: Disease-free survival by age group for Acute Lymphoblastic Leukaemia, 1987-2005 Paediatric is defined as age 18 years and adult age >18 years
1.00 0.75 0.50 Cumulative survival 0.25 0.00 0 1 2 3 4 5 6 7 8 9 10 11 12 13 14 15 16 17 18 19 20 Duration in years Paediatric Figure 1.5.10: Disease-free survival by age group for Thalassaemia, 1987-2005 * No adult cases reported for Thalassaemia. Paediatric is defined as age 18 years and adult age >18 years
1.00 0.75 0.50 Cumulative survival 0.25 0.00 0 1 2 3 4 5 6 7 8 9 10 11 12 13 14 15 16 17 18 19 20 Duration in years Paediatric Adult Figure 1.5.11: Disease-free survival by age group for Non-Hodgkin’s Lymphoma, 1987-2005 Paediatric is defined as age 18 years and adult age >18 years
1.00 0.75 0.50 Cumulative survival 0.25 0.00 0 1 2 3 4 5 6 7 8 9 10 11 12 13 14 15 16 17 18 19 20 Duration in years Paediatric Adult Figure 1.5.12: Disease-free survival by age group for Hodgkin’s Disease, 1987-2005 Paediatric is defined as age 18 years and adult age >18 years
1.00 0.75 0.50 Cumulative survival 0.25 0.00 0 1 2 3 4 5 6 7 8 9 10 11 12 13 14 15 16 17 18 19 20 Duration in years Paediatric Adult Figure 1.5.13: Disease-free survival by age group for Chronic Myeloid Leukaemia, 1987-2005 Paediatric is defined as age 18 years and adult age >18 years
1.00 0.75 0.50 Cumulative survival 0.25 0.00 0 1 2 3 4 5 6 7 8 9 10 11 12 13 14 15 16 17 18 19 20 Duration in years Paediatric Adult Figure 1.5.14: Disease-free survival by age group for Aplastic Anaemia, 1987-2005 Paediatric is defined as age 18 years and adult age >18 years