Download
1 / 19
190 likes | 200 Views
Dawlish Warren. Coastal management and conflicting views at Dawlish Warren ?. Data presentation and analysis. This involves: presentation of data collected in an appropriate range of forms. This could include maps, graphs, photographs, drawings or a combination;

E N D
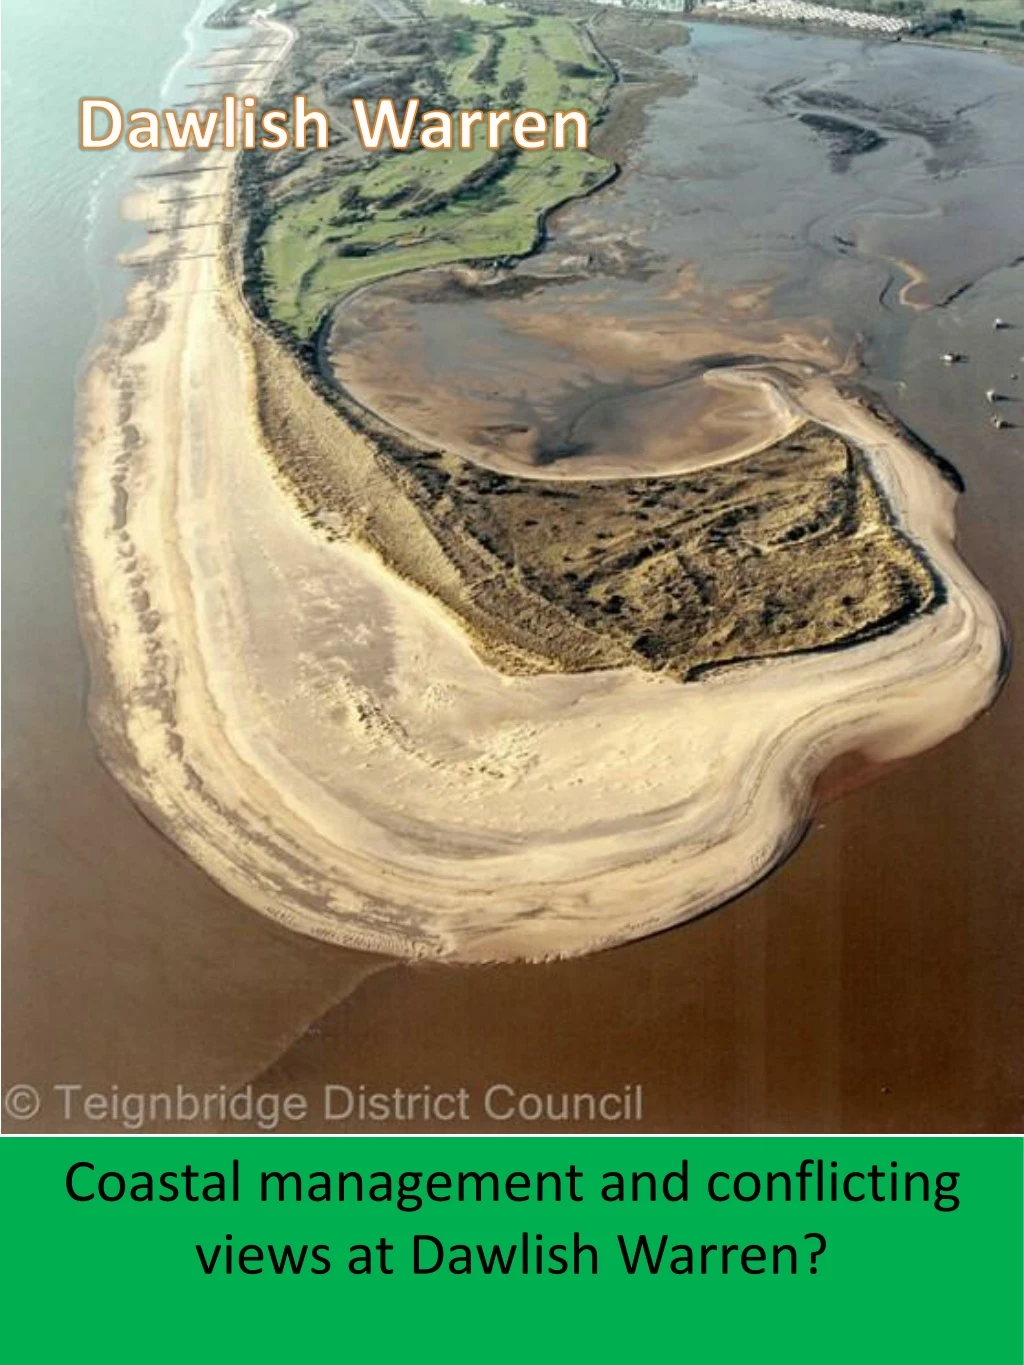
Dawlish Warren Coastal management and conflicting views at Dawlish Warren?
Data presentation and analysis This involves: • presentation of data collected in an appropriate range of forms. This could include maps, graphs, photographs, drawings or a combination; • a description of the key findings shown by the data; • an explanation of the key findings. Coastal management and conflicting views at Dawlish Warren?
2 1 Use a range of data representative techniques. Try to combine maps, photographs and graphs to gain more marks- use A3 if necessary • Process the data that you collected at Dawlish Warren DATA PRESENTATION AND DESCRIPTION OF RESULTS 4 • Describe what your maps, graphs, sketches, photos, tables and diagrams show. • Try to have the description next to the relevant graph • Try to state the obvious, say what the result shows and quote figures. Then explain how your results help to explain how there may be conflicting views regarding the coastal defencesat Dawlish Warren? 3 • All graphs, maps, tables, charts, sketches, photographs and diagrams must be accurate, clearly titled, labelledand referred to in your writing. Coastal management and conflicting views at Dawlish Warren?
Data presentation You need to look at your chosen outcomes for your study. Decide which data helps you to demonstrate your understanding. Produce the relevant maps, graphs, field sketches and annotated photos. You may use or draw your graphs by hand. Certain graphs, such as the height of the beach (groyne measurements) are best drawn by hand. Coastal management and conflicting views at Dawlish Warren?
Data presentation and analysis You need to take each of you outcomes in turn and produce your graphs and maps which best help you analyse that outcome. For example: If you were looking at how successful groynes were at preventing longshore drift, you would use the groyne measurements. You then need to comment on who would like the groynes to be repaired and who would not like that money spent on them – identify stakeholders! Coastal management and conflicting views at Dawlish Warren?
Data presentation Use your data to produce a series of graphs. Remember for groyne measurements and beach height, we measured air space NOT sediment depth. Coastal management and conflicting views at Dawlish Warren?
Data presentation Measurements of sediment on updrift and downdrift sides of the groynes . REMEMBERupdrift towards the shops and proximal end of the spit. Downdrift is towards Exmouth and the distal end of the spit. You measured the ‘airspace’ from the top of the pylon to the beach! Coastal management and conflicting views at Dawlish Warren?
Data presentation Shade in the updrift and downdrift measurements Remember that you measured the air space above the sand. So you measure ‘0’ the top of the pylon. What do you notice about the sediment height between the updrift and downdrift side? Why is this the case? Coastal management and conflicting views at Dawlish Warren?
Data presentation 2 1 Coastal management and conflicting views at Dawlish Warren?
Data presentation Updrift What do you notice about the beach width between the updrift and downdrift side? Why is this the case? How is this related to the prevailing wind? Were the groynes working? Use photos! Downdrift Coastal management and conflicting views at Dawlish Warren?
Data presentation Wave frequency Include data to show what type of waves were operating along the coast. REMEMBER that conditions change – we went on one day only! Coastal management and conflicting views at Dawlish Warren?
Data presentation Visitors centre How successful are the coastal defences at Dawlish Warren?
Data presentation Identify the land uses in the tourist zone and along the spit. Then identify which defences are being used. Which stakeholders would use which part of the spit? Coastal management and conflicting views at Dawlish Warren?
Data presentation Colour code your map to show the land use. Coastal management and conflicting views at Dawlish Warren?
Data presentation A. Rock-armour (rip rap) Cost: £3,500 per metre Built 1977, many repairs since. Rebuilt 1992. Large interlocked boulders. B. Sea wall Cost: £6000 per metre Reflects waves & withstands waves breaking on it C. Concrete Revetment Cost: £2000 per metre Sloping concrete walll absorbs wave energy D. Gabions (stones in wire baskets with cover by sand & marram grass) Cost: £100 per metre E. Groynes (18 built 1972-73 to replace older rotten structures). Cost: £10,000 per groyne Helps trap sand to keep it on the beach. F. Sea wall& rip rap Cost: £9500 per metre See comments above – much stronger combined Direction of longshore drift Identify the location of ALL the sea defences and consider how successful they are at Dawlish Warren. Who would be happy with the defences used? Which stakeholders would not be happy? HINT! This information could be good to use within your assessment Coastal management and conflicting views at Dawlish Warren?
Data presentation How successful is this defence in limiting the effects of erosion, transportation or deposition. Sea Wall How it works What are the defences protecting? Why has this type of defence been built in this location? Who would think this defence is a good idea? Who would think this defence is a good idea? B:Sea Wall Rip Rap How it works How successful is this defence in limiting the effects of erosion, transportation or deposition. What are the defences protecting? Why has this type of defence been built in this location? Coastal management and conflicting views at Dawlish Warren?
Data presentation Complete your sea defence bi-polar analysis of the coastal defences: B:Sea Wall Questions to think about … Are there any relationships between: cost and effectiveness? Attractiveness and effectiveness? Effectiveness and access to the beach? Etc etc. Coastal management and conflicting views at Dawlish Warren?
Data presentation Complete your questionnaire summaries: Questions to think about … What are peoples’ perceptions of the coastal defences at Dawlish Warren? How reliable are their views? Are there any patterns between the views of the person and their reason for visiting Dawlish Warren? Are their any conflicts (disagreements) with peoples’ (stakeholders) opinions? Coastal management and conflicting views at Dawlish Warren?
To what extent is geology the main influence on the distinctive coastal landforms at Dawlish Warren? “They have presented their data in anappropriate range of maps, graphs and diagrams.” “They have used their knowledge and understanding to thoroughly describe and explain their evidence.” (ANNOTATIONS) Coastal management and conflicting views at Dawlish Warren?