Download
1 / 45
460 likes | 618 Views
Sugar-Sweetened Beverages & Health: Where does the Evidence Stand?. Vasanti Malik, PhD Post Doctoral Research Fellow Harvard School of Public Health Department of Nutrition Boston, MA. Overview. Background Epidemiological Data SSB and Obesity SSB and Diabetes

E N D
Sugar-Sweetened Beverages & Health: Where does the Evidence Stand? Vasanti Malik, PhD Post Doctoral Research Fellow Harvard School of Public Health Department of Nutrition Boston, MA
Overview • Background • Epidemiological Data • SSB and Obesity • SSB and Diabetes • SSB and Cardiovascular Risk • Potential Biological Mechanisms • Conclusions • Questions
Worldwide, 1.6 billon people were overweight vs. 0.8 billion were underweight In 2005
Worldwide age-standardized prevalence of overweight (upper) and obesity (lower) in adults 20 years and older by country in 2005. International Journal of Obesity (2008) 32, 1431–1437
9.1% ~ 60 million 6.7% 43 million 4.2% Defined as > 2 SDs above WHO weight- for- height median In 2010 11.7% overweight in developed countries and 6.1% in developing countries. Percentage change b/w 1990 and 2010: 65% in developing countries and 48% in developed countries ) Am J Clin Nutr 2010;92:1257–64.
Medical Complications of Obesity Idiopathic intracranial hypertension Pulmonary disease abnormal function obstructive sleep apnea hypoventilation syndrome Stroke Cataracts Nonalcoholic fatty liver disease steatosis steatohepatitis cirrhosis Coronary heart disease Diabetes Dyslipidemia Hypertension Severe pancreatitis Gall bladder disease Cancer breast, uterus, cervix colon, esophagus, pancreas kidney, prostate Gynecologic abnormalities abnormalmenses infertility polycystic ovarian syndrome Osteoarthritis Phlebitis venousstasis Skin Gout
In 2009, care of diabetes and related complications lead to $113 billion in direct medical costs (2007 US dollars) Diabetes Care 32:2225-2229, 2009
US Trends in per Capita Calories from Beverages 172 kcal/d 175 kcal/d Data for 1965-2002 are from Duffey and Popkin, 2007; data for 2005-2006 are from Brownell et al, 2009 In Canadian children age 2-18 years SSB contributed between 2% and 18% of total energy in 2004 (Canadian Community Health Survey) Public Health Nutr. 2011 Nov;14(11):1961-9. Epub 2011 Jun 23
Global Trends Change in Total Volume of Carbonated Soft Drinks Consumed Between 2002 and 2007 % change in volume of soft drinks consumed, 2002-2007 Euromonitor. Global soft drinks: fınding value in carbonates. London: Euromonitor, 2008
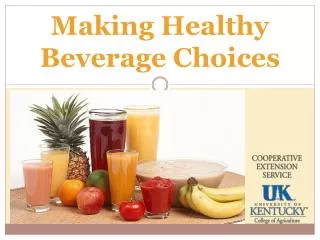
SSB: • Soft drinks, fruit drinks, • energy drinks, iced tea, • lemonade, cordials, punch • composed of energy-containing • sweeteners such as sucrose, • high-fructose corn syrup, • or fruit juice concentrates • Non SSB: • 100% fruit juice and not blended with • added sweeteners is not considered an SSB.
Soft drink ingredients • Energy: 12-14 kcal/ounce or ~150 kcal/12 oz can • Sugars: 3.1-3.6 g/ounce • or ~ 40-50 g sugar/12 oz can (~10 tsp/12 ounce can) • Glycemic index: 63 (with glucose as reference) If these calories are added to the typical US diet, 1 can of soda per day could lead to a weight gain of 15 lb in 3 yrs
Forrest plot of studies evaluating SSB consumption and adiposity in children, per change in BMI units for each 12-oz serving per day change in SSB Fixed Effects: 0.03 (0.01, 0.04) Malik et al. Am J ClinNutr 89: 438-439, 2009
Forrest plot of studies evaluating SSB consumption and adiposity in children per change in BMI units for each 12-oz serving per day change in SSB Malik et al. Am J Clin Nutr 89: 438-439, 2009
N=644 from 6 schools
N=1944 Longitudinal Study of Child Development in Québec (1998-2002) J Am Diet Assoc. 2007;107:924-934
Sugar-sweetened beverages and weight gain over time: Nurses’ Health Study II (N > 50,000) Adjusted for characteristics at each time point Schulze et al. JAMA 2004
N= 43,580 Mean weight change 0.10 kg. Participants in highest category had increase of 0.53 kg compared with infrequent users Am J Epidemiol 2010;171:701–708
Weight change at 18-mo by tertile of change in SSB intake– the PREMIER trial (N=810) }7.0 }3.6 8.4 oz/d 0 oz/d P for trend <0.001 -12.4 oz/d A reduction in SSB intake of 1 serving/d was associated with a weight loss of 0.49 kg (95% CI: 0.11, 0.82; P = 0.006) at 6 mo and of 0.65 kg (95% CI: 0.22, 1.09; P = 0.003) at 18 mo. Chen et al. AJCN 2009
Relationships between Changes in Food and Beverage Consumption and Weight Changes Every 4 Years, According to Study Cohort. N=120,877 Within each 4-year period, participants gained an average of 3.35 lb Mozaffarian D et al. N Engl J Med 2011;364:2392-2404
N=318 Am J Clin Nutr 2012;95:555–63
Forrest Plot of Studies Evaluating SSB intake and Risk of Type 2 Diabetes Fixed-effects estimate: RR 1.25 (1.17, 1.32) Omitting 3 studies that adjusted for BMI and total energy: Random effects: RR 1.28 (1.13, 1.45) N= 310, 819 15, 043 cases Malik et al. 2010. Diabetes Care. 33:2477-2483
Sugar-Sweetened Soft Drinks and Type 2 Diabetes, NHS2 1991-1998 Schulze et al. JAMA 2004
Forrest Plot of Studies Evaluating SSB intake and Risk of Metabolic Syndrome N= 19, 431 5, 803 cases Fixed-effects estimate: RR 1.17 (1.09, 1.26) Malik et al. 2010. Diabetes Care. 33:2477-2483
N= 2774, 20 yr follow-up RR associated with each increase in quartile of SSB consumption Am J Clin Nutr 2010;92:954–9.
Relative Risks for Incident Hypertension According to Frequency of Sugared Cola Intake Nurses’ Health Study (1990-2002) N = 53, 175 2-3 < 1 1 ≥ 4 Nurses’ Health Study II (1991-2003) N = 87, 369 JAMA, November 9, 2005—Vol 294, No. 18 < 1 1 2-3 ≥ 4
Evidence from Short Term Trials: Parallel, 10 wks: Sucrose-rich diet increased postprandial glucose, insulin, and lipids compared artificial sweeteners in overweight healthy subjects. Food Nutr Res 2011;55. Parallel, 10-wks: Sucrose-rich diet increased serum levels of haptoglobin, transferrin and CRP compared artificial sweetener in overweight healthy subjects. Am J Clin Nutr 2005;82(2):421-7 Cross-over, 3 wks: SSB (fructose, sucrose) consumed in small to moderate quantities impaired glucose and lipid metabolism and promoted inflammation in normal-weight healthy men. Am J Clin Nutr 2011;94(2):479-85
24 y follow-up Am J Clin Nutr 2009;89:1037–42.
SSB and risk of CHD in men (N=42 883)Followed for over 22 years Multi-variable adjusted models SSB associated with increased: triglycerides, CRP, IL6, TNFr1, TNFr2, SSB associated with decreased: HDL, Lp(a), and leptin (p values < 0.02). Circulation. 2012;125:1735-1741
Potential biological mechanisms underlying the effect of SSBs on weight gain, and cardiometabolic disease risk Weight gain Insulin Resistance ß-cell dysfunction Inflammation Hypertension Visceral adiposity Atherogenic Dyslipidemia Liquid Calories SSB Met Syn T2DM CHD High GL Fructose Malik et al. Circulation. 2010; 121: 1356-1364
Uric acid may increase blood pressure by development of renal disease, endothelial dysfunction and activation of the rennin-angiotensin system
Strength of the Epidemiologic Evidence Weight gain and obesity *** Type 2 diabetes and metabolic syndrome *** Hypertension, inflammation, dyslipidemia ** CHD *
Bradford Hill Criteria for Causality Applied to Evidence Evaluating SSB Consumption and Risk of Type 2 Diabetes “Biological coherence” and “Analogy” omitted From Malik & Hu. Curr Diab Rep. 2012 Jan 31
Over a 10-year period US $82 billion in medical costs was attributable to excess SSB consumption (defined as one beverage per week). Wang et al HEALTH AFFAIRS 31, NO. 1 (2012): 199–207
SSBs provide little nutritional value and have also been linked to: • gallstone disease • hyperuricemia • gout • kidney disease • fatty liver • decreased bone mineral density • dental carries
Healthy Alternatives? - 17%
Bottom Line: Limiting intake of SSB’s is one simple change that if implemented could have a measurable impact on weight control and risk of diabetes and other metabolic diseases in the general population
AHA recommends no more than 100 kcal (5% energy) for women and 150 kcal (7.5% energy) for men from added sugar
Study % Weight Ludwig, 2001 8.09 Berkey Boys, 2004 18.93 Berkey Girls, 2004 19.43 James, 2004 3.20 Newby, 2004 0.64 Phillips, 2004 8.01 2.94 Blum, 2005 Ebbeling, 2006 0.82 Mundt Boys, 2006 12.49 Mundt Girls, 2006 7.83 Striegel-Moore, 2006 17.63 0.03 (-0.00, 0.07) Combined 100.00 -.59 0 .59 Forrest plot of studies evaluating SSB consumption and adiposity in children, per change in BMI units for each 12-oz serving per day change in SSB (random-effects) Fixed Effects: 0.03 (0.01, 0.04) Malik et al. Am J ClinNutr 89: 438-439, 2009
Serving size Glycemic index Coke 250 mL 63 Mashed potato 1 cup 74 White bread 1 slice 70 Sugar, table 1 tsp 68 Carrots 0.5 cup 47 Pasta 1 cup 42 Glycemic index (GI) • Frequent and high changes in blood glucose are thought to be risk factors for diabetes Glycemic index (GI): AUC / AUCref * 100 AUC AUCref Jenkins et al. 1981. Am J Clin Nutr. 34: 362-6.
Serving size Glycemic index Carbohydate (g) Glycemic load Coke 250mL 63 26 16 Mashed potato 1 cup 74 20 15 White bread 1 slice 70 14 10 Sugar, table 1 tsp 68 10 7 Carrots 0.5 cup 47 6 3 Pasta 1 cup 42 47 20 Glycemic load • Glycemic index does not take into account total carbohydrate Glycemic load: GI * carb / 100 GL ≤ 10 = low GL ≥ 20 = high Salmeron et al. 1997. Diabetes care. 20: 545-50.
Public schools in 40 states Arch Pediatr Adolesc Med. Published online November 7, 2011.