Download
1 / 21
210 likes | 414 Views
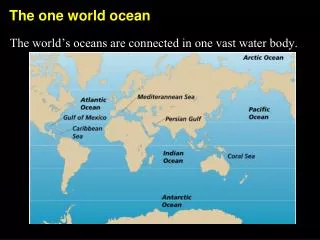
World Ocean Database, World Ocean Atlas, and Regional Climatologies. Ocean Climate Laboratory Team/NODC. Outline. The size and shape of a global ocean profile database Data Archeology and Rescue Data flow into and out of a global ocean profile database

E N D
World Ocean Database, World Ocean Atlas, and Regional Climatologies Ocean Climate Laboratory Team/NODC
Outline • The size and shape of a global ocean profile database • Data Archeology and Rescue • Data flow into and out of a global ocean profile database • NODC products from global ocean database
World Ocean Database (WOD) A quality controlled collection of ocean profiles, plankton tow , and ship-based surface measurements from 1772-present.
Instrument types in WOD Variables in WOD • 1) temperature • 2) salinity • 3) oxygen • 4) phosphate • 5) nitrate • 6) nitrate + nitrite • 6) silicate • 5) chlorophyll • 6) pH • 7) alkalinity • 8) pCO2 • 9) TCO2 • Plankton • 11) CFCs 11, 12, and 113 • 12) Tritium • 13) Helium (noble gas) • 14) ΔHe-3 (isotope) • 15) ΔC-13 (isotope) • 16) ΔC-14 (isotope) • 17) Argon (noble gas) • 18) Neon (noble gas) • 19) O-18 (isotope) • 20) Beam Attenuation Coefficient (transmissivity) 1) Station Data (bottles, thermometers) 2) CTD 3) XBT 4) MBT 5) Towed CTD 6) Profiling Floats 7) Drifting buoy (thermistor chains) 8) Moored buoy (e.g., TAO, PIRATA TRITON) 9) Autonomous Pinniped (instrumented elephant seals) 10) Gliders Blue: Quality control beyond automatic checks
Temperature Data During Peak of Different Observing Systems 1934 : Nansen Cast 1960 : MBT 1985 : XBT Red=Nansen Cast /CTD[1890s/1964] Light Blue=MBT [1939] Dark Blue=XBT [1967] Green=Argo float [2001] Orange=Tropical buoy [1984] 2009 : Argo
Measurements vs. Depth WOD13 Measurements (X105) Measurements (X104) Depth (m) Depth (m)
World Ocean Database • Contains contributions from national data centers, universities, special projects, fisheries, navies, government agencies, individual scientists, merchant ships etc. • Data found on internet, index cards, glass slides, outdated computer media, published cruise reports, etc. • Original data must be accessible in the NODC archive/permission must be obtained for all data
Data Archeology and Rescue Nansen’s Arctic expedition, 1893-1896 Fram (1892 – 1912) Trial cruise Photo: wikipedia Amundsen’s South Pole expedition, 1910-1912 * No data from Sverdrup’s Canadian Archipelago expedition (1898-1902) 5 accessions, 3 cruises
Near-real time data from GTSPP: 2013 Green – XBT (8,340casts) Red – CTD (14,521 casts) Blue - Pinniped(3,970 dives) Turquoise – Glider (20,499half cycles)
Examples of Delayed-mode data Updates to WOD ICES CCHDO Blue – Quarterly Orange- Yearly Green - Irregular WHOI Ice Tethered Buoys TAO maintenance cruises CalCOFI World Ocean Database Quarterly Updates NOAA Northeast Fisheries Japan Ocean Data Center INIDEP (Argentina) CSIRO Line W
Data Dissemination: Yearly by instrument Geographically by instrument WODselect All updated quarterly Format: Native WOD format (compact ASCII) with conversion routines netCDF -> feeds into NODC Geoportal/THREDDS server Working now on subset dissemination through Geoportal
OCL/NODC Science and Data Community MAKE DATA AVAILABLE Convert Data to Common Format/Initial Quality Control Calculate Climatologies Secondary Quality Control Release Database With Quality Control Flags Scientific Research Post-release Quality Control Monthly database updates Publish Results FEEDBACK LOOP
WOA13 salinity at 50 m depth for years 2005-2012 WOA13 temperature at 100 m depth at 1/4° grid resolution
WOA13: Increased horizontal and vertical resolution Gulf Stream Example
NODC Regional Climatologies Up to date, four regional climatologies have been completed and published at NODC web site. Gulf of Mexico (a supplement to the Gulf of Mexico Digital Atlas), the East Asian Seas Climatology, the Arctic and most recently Greenland-Iceland-Norwegian Seas NODC existing and intended regional climatologies in the Northern Hemisphere in FY12-FY16 (the Nordic Seas Atlas is a collaborative NODC-AARI –University of Bergen project). NODC Regional Climatology Team: Seidov, D., O.K. Baranova, M. Biddle, T.P. Boyer, D.R. Johnson, A.V. Mishonov and M. Zweng
GINS Regional Climatology The Greenland, Iceland and Norwegian Seas (GINS) – the gateways for water exchange between the North Atlantic Ocean and the Arctic – play a key role in the entire high-latitudinal ocean climate formation and change. To provide an improved oceanographic foundation and reference for multi-disciplinary studies of the GINS, NODC Regional Climatology Team developed a new set of high-resolution quality-controlled long-term annual, seasonal and monthly mean temperature and salinity fields on different depth levels. Temperature and currents schema at 200 m (Eldevik et al, 2009)
Northwest Atlantic (NWA) Regional Climatology(SMECC; NODC FY14 - work in progress) The NWA high-resolution regional climatology is a part of the NOAA-wide Sustained Marine Ecosystem in Changing Climate (SMECC) Project. NODC Regional Climatology Team1 developed a new set of high-resolution quality-controlled long-term annual, seasonal and monthly mean temperature and salinity fields on different depth levels. This new regional climatology is based on the World Ocean Database 2013 archive of temperature and salinity from observations spanning over more than a hundred years and incorporates a great deal of new data not previously available. High-resolution NWA regional climatology provides quality-controlled temperature and salinity on 87 levels with 1/10°x1/10° grid resolution. NODC NWA web site screenshot (web site is under construction).
High-resolution “all-time” NWA climatology At the moment, the “all-time” NWA climatology has been completed on 1/10x1/10° grid. “All-time” means the climatology was compiled using all available data. There will be decadal climatologies compiled for six decades from 1955-1954 to 2005-2012 (the last “decade” has only eight years of data). The decades 1995-2004 and 2005-2012 will be completed by the end of FY14, while earlier decades are due in FY15. Annual temperature at the surface from NWA regional climatologies with 1°x1°, 1/4°x1/4° and 1/10°x1/10° grid resolution show dramatic improvements provided by high-resolution climatology. 1°x1° 1/4°x1/4° 1/10°x1/10° Annually-averaged climatological sea surface temperature (°C)