Download
1 / 89
890 likes | 1.09k Views
Reverse engineering gene and protein regulatory networks using Graphical Models. A comparative evaluation study. Marco Grzegorczyk Dirk Husmeier Adriano Werhli. Systems biology Learning signalling pathways and regulatory networks from postgenomic data. possibly completely unknown.

E N D
Reverse engineering gene and protein regulatory networks using Graphical Models. A comparative evaluation study. Marco Grzegorczyk Dirk Husmeier Adriano Werhli
Systems biology Learning signalling pathways and regulatory networks from postgenomic data
possibly completely unknown E.g.: Flow cytometry experiments data Here: Concentrations of (phosphorylated) proteins
possibly completely unknown E.g.: Flow cytometry experiments data data Machine Learning statistical methods
extracted network true network Is the extracted network a good prediction of the real relationships?
extracted network true network Evaluation of learning performance biological knowledge (gold standard network)
Reverse Engineering of Regulatory Networks • Can we learnnetwork structures from postgenomic data themselves? • Are there statistical methods to distinguish between direct and indirect correlations? • Is it worth applying time-consuming Bayesian network approaches although computationally cheaper methods are available? • Do active interventions improve the learning performances? • Gene knockouts (VIGs, RNAi)
direct interaction common regulator indirect interaction co-regulation
Reverse Engineering of Regulatory Networks • Can we learnnetwork structures from postgenomic data themselves? • Are there statistical methods to distinguish between direct and indirect correlations? • Is it worth applying time-consuming Bayesian network approaches although computationally cheaper methods are available? • Do active interventions improve the learning performances? • Gene knockouts (VIGs, RNAi)
Three widely applied methodologies: • Relevance networks • Graphical Gaussian models • Bayesian networks
Relevance networks • Graphical Gaussian models • Bayesian networks
Relevance networks(Butte and Kohane, 2000) • Choose a measure of association A(.,.) • Define a threshold value tA • For all pairs of domain variables (X,Y) compute their association A(X,Y) 4. Connect those variables (X,Y) by an undirected edge whose association A(X,Y) exceeds the predefined threshold value tA
Relevance networks(Butte and Kohane, 2000) • Choose a measure of association A(.,.) • Define a threshold value tA • For all pairs of domain variables (X,Y) compute their association A(X,Y) 4. Connect those variables (X,Y) by an undirected edge whose association A(X,Y) exceeds the predefined threshold value tA
direct interaction common regulator indirect interaction co-regulation
Pairwise associations without taking the context of the system into consideration direct interaction pseudo-correlations between A and B E.g.:Correlation between A and C is disturbed (weakend) by the influence of B
1 2 ‘direct interaction’ X 1 2 1 2 X X ‘common regulator’ 1 1 2 2 ‘indirect interaction’ strong correlation σ12
Relevance networks • Graphical Gaussian models • Bayesian networks
1 2 direct interaction 1 2 Graphical Gaussian Models strong partial correlation π12 Partial correlation, i.e. correlation conditional on all other domain variables Corr(X1,X2|X3,…,Xn) But usually: #observations < #variables
Shrinkage estimation of the covariance matrix (Schäfer and Strimmer, 2005) 0<λ0<1 estimated (optimal) shrinkage intensity, with where is guaranteed
direct interaction common regulator indirect interaction co-regulation
Graphical Gaussian Models direct interaction common regulator indirect interaction P(A,B)=P(A)·P(B) But: P(A,B|C)≠P(A|C)·P(B|C)
Further drawbacks • Relevance networks and Graphical Gaussian models can extract undirected edges only. • Bayesian networks promise to extract at least some directed edges. But can we trust in these edge directions? It may be better to learn undirected edges than learning directed edges with false orientations.
Relevance networks • Graphical Gaussian models • Bayesian networks
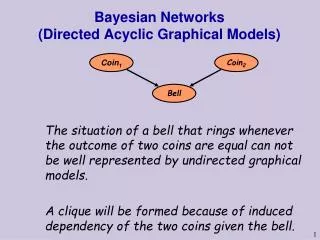
Bayesian networks NODES • Marriage between graph theory and probability theory. • Directed acyclic graph (DAG) represents conditional independence relations. • Markov assumption leads to a factorization of the joint probability distribution: A B C EDGES D E F
Bayesian networks versus causal networks Bayesian networks represent conditional (in)dependency relations - not necessarily causal interactions.
Node A unknown A A True causal graph B C B C Bayesian networks versus causal networks
Bayesian networks NODES • Marriage between graph theory and probability theory. • Directed acyclic graph (DAG) represents conditional independence relations. • Markov assumption leads to a factorization of the joint probability distribution: A B C EDGES D E F
Bayesian networks Parameterisation:Gaussian BGe scoring metric: data~N(μ,Σ) with normal-Wishart distribution of the (unknown) parameters, i.e.: μ~N(μ*,(vW)-1) and W~Wishart(T0)
Bayesian networks BGe metric: closed form solution
Learning the network structure graph → scoreBGe(graph) Idea: Heuristically searching for the graph M* that is most supported by the data P(M*|data)>P(graph|data), e.g. greedy search
MCMC sampling of Bayesian networks • Better idea: Bayesian model averaging via Markov Chain Monte Carlo (MCMC) simulations • Construct and simulate a Markov Chain (Mt)t in the space of DAGs {graph} whose distribution converges to the graph posterior distribution as stationary distribution, i.e.: P(Mt=graph|data) → P(graph|data) t → ∞ to generate a DAG sample: G1,G2,G3,…GT
A A B F C C D D E E A F A B C D E F A F C D E B → DAG Order MCMC(Friedman and Koller, 2003) • Order MCMC generates a sample of node orders from which in a second step DAGs can be sampled: Acceptance probability (Metropolis Hastings) G1,G2,G3,…GT DAG sample
A C B Equivalence classes of BNs A C B A C A B P(A,B)≠P(A)·P(B) P(A,B|C)=P(A|C)·P(B|C) C B A C completed partially directed graphs (CPDAGs) B v-structure A P(A,B)=P(A)·P(B) P(A,B|C)≠P(A|C)·P(B|C) C B
A B C D E F A B C D E F CPDAG representations CPDAGs DAGs Utilise the CPDAG sample for estimating the posterior probability of edge relation features: where I(Gi) is 1 if the CPDAG Gi contains the directed edge A→B, and 0 otherwise
A B C A D B C E F D E F A B C D E F CPDAG representations CPDAGs interpretation DAGs superposition Utilise the DAG (CPDAG) sample for estimating the posterior probability of edge relation features: where I(Gi) is 1 if the CPDAG of Gi contains the directed edge A→B, and 0 otherwise
Interventional data A and B are correlated A B inhibition of A A B A B A B down-regulation of B no effect on B
Evaluation of Performance • Relevance networks and Graphical Gaussian models extract undirected edges (scores = (partial) correlations) • Bayesian networks extract undirected as well as directed edges (scores = posterior probabilities of edges) • Undirected edges can be interpreted as superposition of two directed edges with opposite direction. • How to cross-compare the learning performances when the true regulatory network is known? • Distinguish between DGE (directed graph evaluation) and UGE (undirected graph evaluation)
Probabilistic inference - DGE true regulatory network edge scores data high low Thresholding concrete network predictions TP:1/2 FP:0/4 TP:2/2 FP:1/4
Probabilistic inference - UGE skeleton of true regulatory network undirected edge scores add up scores of directed edges with opposite direction data
Probabilistic inference - UGE skeleton of true regulatory network + undirected edge scores add up scores of directed edges with opposite direction data + +
Probabilistic inference skeleton of true regulatory network undirected edge scores data
Probabilistic inference skeleton of true regulatory network undirected edge scores data high low Thresholding concrete network (skeleton) predictions TP:1/2 FP:0/1 TP:2/2 FP:1/1
Evaluation 1: AUC scoresArea under Receiver Operator Characteristic (ROC) curve sensitivity inverse specificity AUC=0.5 AUC=1 0.5<AUC≤1
Evaluation 2: TP scores We set the threshold such that we obtained 5 spurious edges (5 FPs) and counted the corresponding number of true edges (TP count).
Evaluation 2: TP scores 5 FP counts
Evaluation 2: TP scores BN GGM RN 5 FP counts