Download
1 / 13
130 likes | 325 Views
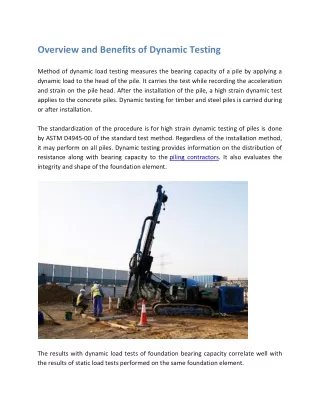
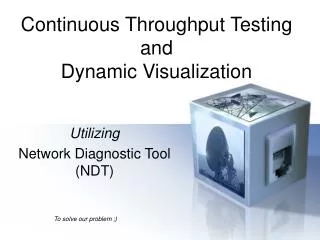
Continuous Throughput Testing and Dynamic Visualization. Utilizing Network Diagnostic Tool (NDT). To solve our problem ;). Why did we do this project?. MCNC was requested to perform network throughput and quality testing for hundreds of K-12 schools in NC.

E N D
Continuous Throughput Testing and Dynamic Visualization Utilizing Network Diagnostic Tool (NDT) To solve our problem ;)
Why did we do this project? • MCNC was requested to perform network throughput and quality testing for hundreds of K-12 schools in NC. • We had several constraints that limited our testing ability. • TIME was an issue, we had to move fast!! • Visualization was extremely important to convey the results to both technical and non-technical audiences.
What was the problem to solve? • Perform network testing at remote locations with virtually no IT “hands” on-site. • We could not install any software or hardware at the remote sites. • The data should reflect the actual network performance of the student “end-host” computers. • How to get the results in a format that anyone can read/understand.
What did we do? Modified NDT java applet • Manipulated applet to run continuously after “start” initiated • Tcpbw100.java modified to re-run test every 5 min after the start button is clicked Wrote Custom PHP Scripts • Parsed web100srv log files for results • Extracted date/time, IP address, upload and download speeds • Wrote data to RRD files for later graphing / analysis • Built 4 NDT Servers • With all the usual suspects (NDT v.5.4.12, Web100 modified kernel, Userland libraries) • Imaged every box with CactiEZ CD Beta v0.2b
Testing, Testing, 1,2,3… • We needed to see how the modified NDT would operate with a heavy load • Conducted initial testing on staff at MCNC on one NDT server • We estimated we needed 4 NDT servers--somewhat arbitrary (but it worked!) • Challenges • Firewall ports • Screensaver/Sleep mode • We tested schools over a week and coordinated timing with Tech Directors across the State of NC.
Results! • We had ~130 schools attempt the testing. • Of those, we had around 80 schools with enough data to show connection quality. • Results varied among schools and school systems. • One problem we found (after the fact) is several school systems used NAT, so results were inconclusive for individual schools.
Next Steps… • Ability to enter information before running the test, and capturing that information into the logs/results. • Integration into Cacti (automatically create graphs and datasources in MYSQL. • Ability to pick times the test will run again. • Ability to start testing without having to press “Start”. • Based on results of tests, recommend TCP tuning parameters.
Vision – Communication - Collaboration DEMO ! NDT Test NDT Test Results
Vision – Communication - Collaboration Questions? Comments? Andrew @ mcnc.org Carla @ mcnc.org