Download
1 / 30
300 likes | 428 Views
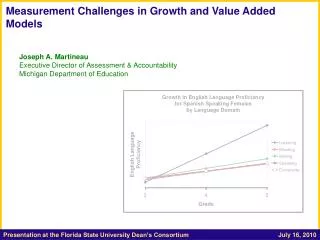
Maps to Success: Using Data. Richard Mahon, Curriculum Committee Beth Smith, Grossmont College Greg Stoup, Cañda College Key reference: Data 101. 2010 ASCCC Curriculum Institute Santa Clara Marriott • July 8-10, 2010. Maps to Success: Using Data.

E N D
Maps to Success: Using Data • Richard Mahon, Curriculum Committee • Beth Smith, Grossmont College • Greg Stoup, Cañda College • Key reference: Data 101 2010 ASCCC Curriculum Institute Santa Clara Marriott • July 8-10, 2010
Maps to Success: Using Data Accreditation standards require that colleges assess the curriculum at the course, program, and degree levels. What data would allow the curriculum committee to contribute to broader campus conversations about student learning, and how can the curriculum development and approval process help guide faculty toward the thoughtful use of data in evaluating and improving their own effectiveness? Does your curriculum committee concern itself with data? 2010 ASCCC Curriculum Institute Santa Clara Marriott • July 8-10, 2010
Maps to Success: Using Data Curriculum, data and institutional processes… • Program Review • Student Learning Outcome Assessment • Student Equity • Enrollment Management 2010 ASCCC Curriculum Institute Santa Clara Marriott • July 8-10, 2010
Maps to Success: Using Data • System Data: Datamart http://www.cccco.edu/ChancellorsOffice/Divisions/TechResearchInfo/MIS/DataMartandReports/tabid/282/Default.aspx) • ARCC Report: • CalPASS - http://www.cal-pass.org/ • NCES National Center for Education Statistics http://nces.ed.gov/ • CPEC California Postsecondary Commission http://www.cpec.ca.gov/ • Local Data? 2010 ASCCC Curriculum Institute Santa Clara Marriott • July 8-10, 2010
Maps to Success: Using Data Data for what? • Prerequisites • Labor Market Analysis • Student performance • Student completions (certificates, degrees, transfer) 2010 ASCCC Curriculum Institute Santa Clara Marriott • July 8-10, 2010
The Challenges with using college data to identify strategic interventions
Packaging the message To the outsider, researchers can have an intimidating comfort zone The wrong format creates dissonance between your message and your audience.
Consider a simple pathway assessment Basic Skills Student Hypothesis: Learning Communities improve the transfer success of Basic Skills students Learning Community We pull data from our database to test the hypothesis …. Successful Transfer
We learn that we need more info to tell the real story Basic Skills Student Complete SEP Learning Community Enroll Full-Time Take Summer Courses Enroll in MESA Successful Transfer
But the reality is… Library Orientation Text books in stock Basic Skills Student Planning advice from FA Office Join Student Club Faculty suggest outside reading Complete SEP Attend Lecture Series Learning Community Enroll Full-Time Becomes student tutor Participate in Student Govt Placement Test Prep Take Summer Courses Talk to Univ. Rep Meet with Outreach Professional Hallway chat with professor Enroll in MESA Good impression from Campus Visit Faculty recommends MESA Successful Transfer Nurture Faculty Relationships Faculty Letter of Recommendation
Examples of Program Level Data that can drive curricular discussion
There is significant variation in persistence across the six segments.
Segment Persistence One Year Fall-to-Fall College Average 39.1% Two Year Fall-to-Fall College Average 24.4%
Segment Success & Retention Success Rates College Average 70.0% Retention Rates College Average 84.5%
Can we build on this information? An estimate of the resource usage patterns of each segment (low, medium, high) might help us develop strategies to more effectively deploy rare resources.
ESL Students have low persistence in part because many navigate long course sequences. ESL Persistence by Student Entry Level (Tracking Period: Fall 2000 – Spring 2008) Persistence patterns generally follow a 50% Rule * ESL400 category also includes ENGL 836
In any given term roughly half of our students are Single Course Takers Students Taking a Single Course Students Taking Multiple Courses *Persistence Rate = 50.3% *Persistence Rate = 29.8% • Why is this important? • Single Course Takers have a more tenuous connection to the college • Single Course Takers have low persistence • Returning students that become single course takers are 80% less likely to transfer or obtain a degree† *Includes only the Base Segment population of Basic Skills, Career Directed & Transfer Directed Students. †Adjustments were made to account for students whose course load dropped in the final term before transfer or receiving a degree.
Single Course Takers are not uniformly distributed across the Student Segments Headcounts of Single Course Takers & Percentage of Segment Population 68% 59% College Average = 47% 14% 58% 40% 69%
Sequence Completion Rates by Initial Course Placement Basic Skills Curriculum Sequence PRE ALGEBRA ELEMENTARY ALGEBRA TRANSFER LEVEL MATH INTERMEDIATE ALGEBRA Course Pass % = 55% Course Pass % = 50% Course Pass % = 55% Course Pass % = 75% Percent of Students Completing the Algebra Sequence within 2 to 5 Years Initial Placement 2 years 2.3% 15.5% 43.4% 3 years 3.6% 19.1% 47.6% 4 years 5.4% 20.6% 49.2% 5 years 6.1% 22.4% 49.2% PRE ALGEBRA ELEMENTARY ALGEBRA INTERMEDIATE ALGEBRA
Profile of Developmental English & Reading Basic Composition Writing Development TRANSFER LEVEL ENGLISH Course Pass % = 64% Course Pass % = 58% Developmental Reading Reading Strategies Course Pass % = 69% Course Pass % = 58% Course Pass % = 67% Percent of Students Completing the Basic Skills Sequence within 2 to 5 Years Initial Placement 2 years 20.3% 22.1% 3 years 23.9% 24.8% 4 years 27.2% 29.9% 5 years 27.7% 30.1% ENGL 826 READ 826
Examples of often overused metrics that, in isolation, can lead to false conclusions
What are the two measures most widely used by CCCs to assess progress? • Consider the multitude of changes over this period: • - faculty/staff turnover • program successes/failures • changing student demographics • budget contractions/expansion • leadership turnover • and yet these performance metrics remained relatively stable. • Success Rate • Retention Rate
What to do when you reach the limits of what data can answer The data helped shrink the number of options but there is still more than one choice You start off with a large number of options Trust your intuition and choose ! ( You’ve talked with your colleagues & reflected on the data )
Handout: An illustration of a collaborative dialogue converging on action
Collaborative Model of Institutional Research Primary Responsibility Faculty/Staff Researcher Joint Activity • Key Features: • Dialog-rich • Jointly-driven processes • Priority on the development of the data story
Joint Reflection on Findings Design Charrette Validate Message Story Development Share the Story
What characterizes a learning organization? An attitude of wisdom (knowing what you don’t know) Commitment to framing issues with data Commitment to hearing & telling the truth Adoption of an experimental mindset Oriented toward action Source: Jeffrey Pfeffer, Professor of Organizational Behavior at the Graduate School of Business, Stanford University.
Nurturing a Culture of Inquiry DISCUSSION
If you remember only one thing Make sure you have a room, populated with reflective thinkers, that meet regularly, to discuss data and ask questions
Nurturing a Culture of Inquiry THANK YOU


![2010 Division of Revenue Bill [B4-2010]](https://cdn2.slideserve.com/4044262/2010-division-of-revenue-bill-b4-2010-dt.jpg)