Download
1 / 21
220 likes | 274 Views
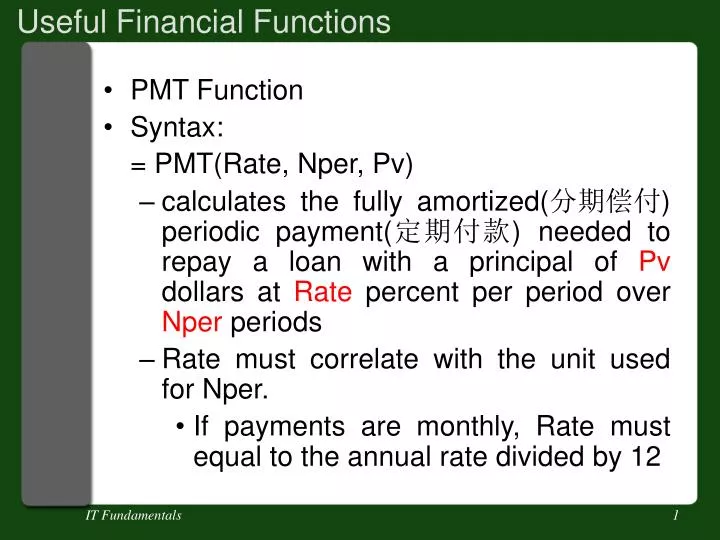
Useful Financial Functions. PMT Function Syntax: = PMT(Rate, Nper, Pv) calculates the fully amortized( 分期偿付 ) periodic payment( 定期付款 ) needed to repay a loan with a principal of Pv dollars at Rate percent per period over Nper periods

E N D
Useful Financial Functions • PMT Function • Syntax: • = PMT(Rate, Nper, Pv) • calculates the fully amortized(分期偿付) periodic payment(定期付款) needed to repay a loan with a principal of Pv dollars at Rate percent per period over Nper periods • Rate must correlate with the unit used for Nper. • If payments are monthly, Rate must equal to the annual rate divided by 12 IT Fundamentals
Example of PMT Function • to calculate a monthly payment (paid on the last day of the month) for a three-year loan of $10,000 at an annual 15% interest rate: • =PMT(0.15/12,3*12,10000) • The monthly payment for a 3 year, $10,000 loan at 15% is $ 346.65 IT Fundamentals
Useful Financial Functions • FV Function • Syntax: • = FV(Rate, Nper, Pmt) • returns the future value of an investment(投资额) where Pmt is invested for Nper periods at the rate of Rate per period IT Fundamentals
Example of PV Function • Assume you want to set aside $500 at the end of each year in a savings account that earns 15% annually. To determine what the account will be worth at the end of six years, enter this formula: • =FV(15%,6,-500) • In 6 years, the yearly payments of $500 will be worth: $4,376.87 IT Fundamentals
Spreadsheets • Steps in Creating a Chart: • Enter the numbers into a workbook. • Select the data to be charted. • Choose Chart from the Insert menu. • Choose either Chart Type from the Format menu or click on the ChartWizard button. • Define parameters such as titles, scaling color, patterns, and legend. • These five steps should be performed in this order. Note that since the chart is linked to the workbook data, any subsequent changes made to the workbook are automatically reflected in the chart. IT Fundamentals
Spreadsheets The PIE Chart is usually used to look at what makes up a wholeSomething. If you had a pie chart of where you spent your money you could look at the percentages of dollars spent on food (or any other category). For example: Expenses in January IT Fundamentals
Spreadsheets The Column Chart is usually used to display a change (growth or decline) over a time period. You can quickly compare the numbers of two different bar charts to each other. IT Fundamentals
Spreadsheets • Stacked Column Graph • Shows total of all data ranges as well as the proportion of each data range IT Fundamentals
Spreadsheets • XY Graph • Shows the relationship of one factor against another IT Fundamentals
Spreadsheets Assignment 1 The Sharpshooter Snooker Center is the new craze in town. It is the new local spot where competitors from far and wide gathered to play for the weekly prize money. Henry Thomas, the owner believes the time has come to improve the control and efficiency of his business. Currently, all details are recorded manually but with the increased popularity of the snooker competition, he is convinced that his workload could be somewhat reduced by entering the financial details of his business into a spreadsheet. ( Value: 10 %) IT Fundamentals
The following represents Sharpshooter’s current and anticipated income for the next 12 months • General table hire operates all year round whilst the competition operates only for the first 6 months of the year. • General Takings for table hire • $3,500 per month • Extra takings during competition season • $4,000 per month • Canteen takings all year • $2,600 per month IT Fundamentals
Due to Sharpshooter’s popularity, general takings are increasing by 6% per month. • Donation from an ex-snooker champion who has taken an interest in the new location • $500 at the beginning of each quarter IT Fundamentals
Current and anticipated expenses for the next 12 months • Food supplies for canteen • 25% of total monthly income (excluding donation) if in competition season • 16% of total monthly income (excluding donation) if out of competition season • Rent • $2,500 per month IT Fundamentals
Hours worked per month Bonus paid to employee 0 – 29 $0 30 – 64 $30 65 – 99 $50 100 + $80 • Henry employs 2 part-time workers whose number of hours worked differs from month to month. Extra bonuses are given to employees who work for longer hours in the month. This can be shown by the following table. (Assume whole hours only). IT Fundamentals
Every staff member gets $12 per hour plus extra bonus amounts for longer hours worked. • The number of hours worked per month by each worker is given below: • Maintenance expenses (repair or replace table felt, new chalk, repair or replace billiard cues etc) - $300 per month (increasing by $8 per month) IT Fundamentals
Part (a) • Your task is to design a spreadsheet for Henry listing all expenses and income arriving at appropriate totals which show the financial position for the sharpshooter Snooker Center for each of the 12 months. Allow maximum flexibility so changes can easily be made. Layout of the spreadsheet should be in a neat, easy to follow manner. IT Fundamentals
Hand in: • An explanation of the general layout of the spreadsheet and how Henry would use the spreadsheet to enter his base figures, and what he should look at to determine profits/losses. (Indicate any lookup tables and sophisticated formulae used). • Change the name of sheet1 to PartA(1) • A copy of the display of your model. This should be printed with gridlines and row & column headings. To do this, go to File/Page Setup/Sheet – click on Gridlines & Row and Column Headings check boxes. IT Fundamentals
Hand in: • A copy of the contents of your model (i.e. the formulae you have used - you only need to print a section of your worksheet to show an example of each of the general formulae used (submit at least 2 columns that demonstrate adequate proof of the use of formulae). Highlight the desired columns and then choose the Tools/Options/View/Window Options– click on theFormulascheck box. You may still need to widen some columns. • Put the result in sheet2 • Change the name of sheet3 to PartA(3) IT Fundamentals
Hand in: • Three separate graphs, one showing any profit or loss made over the 8 years, another showing the breakdown of one year’s expenses and a third graph of your choice with a description of what it is showing. • Put profit or loss graph in a chart named “profit or loss” • Put breakdown graph in a chart named “breakdown” • Put your choice graph in a chart named “myname’s choice”(use your real name to replace myname) IT Fundamentals
Part (b) • By the second half of the year (beginning from month 7), it is believed that a professional snooker player will be performing trick sessions as an added attraction. • His fee is $600 per month which will increase by 4% every month. Include this change into the model whilst maintaining maximum flexibility. IT Fundamentals
Hand In: • A copy of the display and formulas of the revised model with this inclusion. • display:in a sheet name PARTB(1-1) • formulas :in a sheet name PARTB(1-2) • A graph spanning 12 months that shows the profits before and after this inclusion. • In a chart named PARTB(2) IT Fundamentals