Download
1 / 1
10 likes | 111 Views
Tue, Nov 6, 2007 223-3; # 936. Plants responses to nutrients follow a Michaelis-Menten relationship Rogério P. Lana 1. 1 Departamento de Zootecnia-UFV, 36.571-000, Vi ç osa, MG, Brazil; Sponsored by CNPq - Bras í lia, DF, Brazil; Correspondence: rlana@ufv.br . UNIVERSIDADE FEDERAL DE VIÇOSA.

E N D
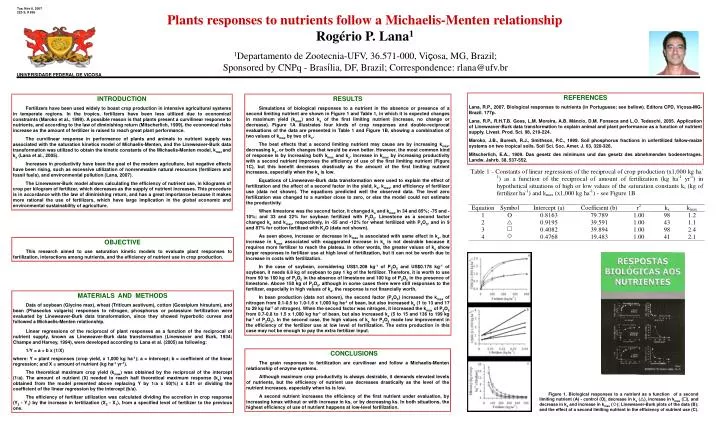
Tue, Nov 6, 2007223-3; # 936 Plants responses to nutrients follow a Michaelis-Menten relationship Rogério P. Lana1 1Departamento de Zootecnia-UFV, 36.571-000, Viçosa, MG, Brazil; Sponsored by CNPq - Brasília, DF, Brazil; Correspondence: rlana@ufv.br UNIVERSIDADE FEDERAL DE VIÇOSA REFERENCES Lana, R.P., 2007. Biological responses to nutrients (in Portuguese; see bellow). Editora CPD, Viçosa-MG-Brazil. 177p. Lana, R.P., R.H.T.B. Goes, L.M. Moreira, A.B. Mâncio, D.M. Fonseca and L.O. Tedeschi, 2005. Application of Lineweaver-Burk data transformation to explain animal and plant performance as a function of nutrient supply. Livest. Prod. Sci. 98, 219-224. Maroko, J.B., Buresh, R.J., Smithson, P.C., 1999. Soil phosphorus fractions in unfertilized fallow-maize systems on two tropical soils. Soil Sci. Soc. Amer. J. 63, 320-326. Mitscherlich, E.A., 1909. Das gesetz des minimuns und das gesetz des abnehmenden bodenertrages. Landw. Jahrb. 38, 537-552. RESULTS Simulations of biological responses to a nutrient in the absence or presence of a second limiting nutrient are shown in Figure 1 and Table 1, in which it is expected changes in maximum yield (kmax) and ks of the first limiting nutrient (increase, no change or decrease). Figure 1A illustrates four kinds of crop responses and double-reciprocal evaluations of the data are presented in Table 1 and Figure 1B, showing a combination of two values of kmax by two of ks. The best effects that a second limiting nutrient may cause are by increasing kmax, decreasing ks, or both changes that would be even better. However, the most common kind of response is by increasing both kmax and ks. Increase in kmax by increasing productivity with a second nutrient improves the efficiency of use of the first limiting nutrient (Figure 1C), but this benefit decreases drastically as the amount of the first limiting nutrient increases, especially when the ks is low. Equations of Lineweaver-Burk data transformation were used to explain the effect of fertilization and the effect of a second factor in the yield, ks, kmax, and efficiency of fertilizer use (data not shown). The equations predicted well the observed data. The level zero fertilization was changed to a number close to zero, or else the model could not estimate the productivity. When limestone was the second factor, it changed ks and kmax in 34 and 85%; -75 and -10%; and 33 and 22% for soybean fertilized with P2O5. Limestone as a second factor changed ks and kmax, respectively, in -55 and -12% for wheat fertilized with P2O5, and in 9 and 87% for cotton fertilized with K2O (data not shown). As seen above, increase or decrease in kmax is associated with same effect in ks, but increase in kmax associated with exaggerated increase in ks is not desirable because it requires more fertilizer to reach the plateau. In other words, the greater values of ks show larger responses in fertilizer use at high level of fertilization, but it can not be worth due to increase in costs with fertilization. In the case of soybean, considering US$1.208 kg-1 of P2O5 and US$0.178 kg-1 of soybean, it needs 6.8 kg of soybean to pay 1 kg of the fertilizer. Therefore, it is worth to use from 50 to 100 kg of P2O5 in the absence of limestone and 100 kg of P2O5 in the presence of limestone. Above 150 kg of P2O5, although in some cases there were still responses to the fertilizer, especially in high values of ks, the response is not financially worth. In bean production (data not shown), the second factor (P2O5) increased the kmax of nitrogen from 0.1-0.5 to 1.0-1.6 x 1,000 kg ha-1 of bean, but also increased ks (1 to 13 and 17 to 29 kg ha-1 of nitrogen). When the second factor was nitrogen, it increased the kmax of P2O5 from 0.7-0.8 to 1.5 x 1,000 kg ha-1 of bean, but also increased ks (5 to 15 and 136 to 199 kg ha-1 of P2O5). In the second case, the high values of ks for P2O5 made low improvement in the efficiency of the fertilizer use at low level of fertilization. The extra production in this case may not be enough to pay the extra fertilizer input. INTRODUCTION Fertilizers have been used widely to boast crop production in intensive agricultural systems in temperate regions. In the tropics, fertilizers have been less utilized due to economical constraints (Maroko et al., 1999). A possible reason is that plants present a curvilinear response to nutrients, and according to the law of diminishing return (Mitscherlich, 1909), the economical risks increase as the amount of fertilizer is raised to reach great plant performance. The curvilinear response in performance of plants and animals to nutrient supply was associated with the saturation kinetics model of Michaelis-Menten, and the Lineweaver-Burk data transformation was utilized to obtain the kinetic constants of the Michaelis-Menten model, kmax and ks (Lana et al., 2005). Increases in productivity have been the goal of the modern agriculture, but negative effects have been rising, such as excessive utilization of nonrenewable natural resources (fertilizers and fossil fuels), and environmental pollution (Lana, 2007). The Lineweaver-Burk model allows calculating the efficiency of nutrient use, in kilograms of crop per kilogram of fertilizer, which decreases as the supply of nutrient increases. This procedure is in accordance with the law of diminishing return, and has a great importance because it makes more rational the use of fertilizers, which have large implication in the global economic and environmental sustainability of agriculture. OBJECTIVE This research aimed to use saturation kinetic models to evaluate plant responses to fertilization, interactions among nutrients, and the efficiency of nutrient use in crop production. MATERIALS AND METHODS Data of soybean (Glycine max), wheat (Triticum aestivum), cotton (Gossipium hirsutum), and bean (Phaseolus vulgaris) responses to nitrogen, phosphorus or potassium fertilization were evaluated by Lineweaver-Burk data transformation, since they showed hyperbolic curves and followed a Michaelis-Menten relationship. Linear regressions of the reciprocal of plant responses as a function of the reciprocal of nutrient supply, known as Lineweaver-Burk data transformation (Lineweaver and Burk, 1934; Champe and Harvey, 1994), were developed according to Lana et al. (2005) as following: 1/Y = a + b x (1/X) where: Y = plant responses (crop yield, x 1,000 kg ha-1); a = intercept; b = coefficient of the linear regression; and X = amount of nutrient (kg ha-1 yr-1). The theoretical maximum crop yield (kmax) was obtained by the reciprocal of the intercept (1/a). The amount of nutrient (X) needed to reach half theoretical maximum response (ks) was obtained from the model presented above replacing Y by 1/a x 50(%) x 0.01 or dividing the coefficient of the linear regression by the intercept (b/a). The efficiency of fertilizer utilization was calculated dividing the accretion in crop response (Y2 - Y1) by the increase in fertilization (X2 - X1), from a specified level of fertilizer to the previous one. CONCLUSIONS The grain responses to fertilization are curvilinear and follow a Michaelis-Menten relationship of enzyme systems. Although maximum crop productivity is always desirable, it demands elevated levels of nutrients, but the efficiency of nutrient use decreases drastically as the level of the nutrient increases, especially when ks is low. A second nutrient increases the efficiency of the first nutrient under evaluation, by increasing kmax without or with increase in ks, or by decreasing ks. In both situations, the highest efficiency of use of nutrient happens at low-level fertilization. Figure 1. Biological responses to a nutrient as a function of a second limiting nutrient (A) - control (O), decrease in ks (), increase in kmax (), and decrease in ks and increase in kmax (); Lineweaver-Burk plots of the data (B); and the effect of a second limiting nutrient in the efficiency of nutrient use (C).