Download

1 / 17
170 likes | 260 Views
Discrim Continued. Psy 524 Andrew Ainsworth. Types of Discriminant Function Analysis . They are the same as the types of multiple regression

E N D
Discrim Continued Psy 524 Andrew Ainsworth
Types of Discriminant Function Analysis • They are the same as the types of multiple regression • Direct Discrim – is just like simultaneous multiple regression when all predictors enter the equation at the same time and each predictor is only credited for its unique variance
Types of Discriminant Function Analysis • Sequential (hierarchical) – predictors are given priority in terms of its theoretical importance, • allowing you to assign the shared variance to variables that are more important. • This is a user defined approach. • Sequential discrim can be used to assess a set of predictors in the presence of covariates that are given highest priority.
Types of Discriminant Function Analysis • Stepwise (statistical) – this is an exploratory approach to discriminant function analysis. • Predictors are entered (or removed) according to statistical criterion. • This often relies on too much of the chance variation that does no generalize to other samples unless cross-validation is used.
Statistical Inference • Evaluating the overall significance of a discriminant function analysis is the same test as for MANOVA • Choices between Wilk’s Lambda, Pillai’s Trace, Hotelling’s Trace and Roy’s Largest Root are the same as when dealing with MANOVA
Number of Functions and percent of Variance • Discriminant functions are extracted in the same way that canonical correlations are extracted. Eigenvalues and eigenvectors are extracted and then used to calculate the discriminant functions • With each eigenvalue extracted most programs (e.g. SPSS) display the percent of between groups variance accounted for by each function.
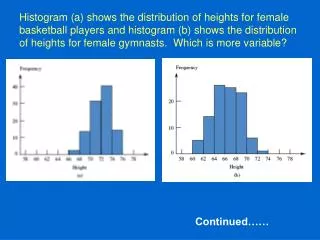
Interpreting discriminant functions • Dicsriminant function plots – interpret how the functions separate the groups • An easy visual approach to interpreting the dicriminant functions is to plot each group centroid in a two dimensional plot with one function against another function. If there are only two functions and they are both reliable then you put Function 1 on the X axis and Function 2 on the Y axis and plot the group centroids.
Interpreting discriminant functions • plot of the group centroids • 1 separates the mem group from the com and perc groups • 2 separates the com group from the mem and perc groups • Both functions are needed to separate each group.
Loadings • Loading matrices – loadings are the correlations between each predictor and a function. It tells you how much (relatively) each predictor is adding to the function. • The loadings allow you to interpret the meaning of each discriminant function
Loadings • A is the loading matrix, Rw is the within groups correlation matrix, D is the standardized discriminant function coefficients.
Design complexity • Factorial discrim designs • This is done in two steps • Evaluate the factorial MANOVA to see what effects are significant • Evaluate each significant effect through discrim
Design complexity • If there is a significant interaction then the discrim is ran by combining the groups to make a one way design • (e.g. if you have gender and IQ both with two levels you would make four groups high males, high females, low males, low females) • If the interaction is not significant than run the discrim on each main effect separately.
Evaluating Classification • How good is the classification? • Classification procedures work well when groups are classified at a percentage higher than that expected by chance • This depends on whether there are equal groups because the percentage than is evenly distributed
Evaluating Classification • If the groups are not equal than there are a couple of steps • Calculate the expected probability for each group relative to the whole sample. • For example if there are 60 subjects; 10 in group 1, 20 in group 2 and 30 in group three than the percentages are .17, .33 and .50. This is now the prior distribution.
Evaluating Classification • The computer program will then assign 10, 20 and 30 subjects to the groups. • In group one you would expect .17 by chance or 1.7, • in group two you would expect .33 or 6.6 • and in group 3 you would expect .50 or 15 would be classified correctly by chance alone. • If you add these up 1.7 + 6.6 + 15 you get 23.3 cases would be classified correctly by chance alone. • So you hope that you classification works better than that.
Evaluating Classification • Cross-Validation – • To see if your classification works well, one of the easiest methods is to split the data in half randomly, forming two new data sets. • Estimate the classification on half of the data and then apply it to the other half to see if it does equally as well. This allows you to see how well the classification generalizes to new data.