Download
1 / 22
220 likes | 340 Views
The semi-subsistence profile of the Romanian agriculture. PAUN ION OTIMAN, COSMIN SALASAN Romanian Academy – Branch of Timişoara , Research Centre for Sustainable Rural Development of Romania. Agriculture.

E N D
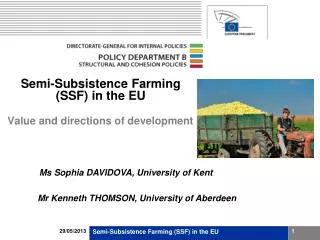
The semi-subsistence profile of the Romanian agriculture PAUN ION OTIMAN, COSMIN SALASAN Romanian Academy – Branch of Timişoara, Research Centre for Sustainable Rural Development of Romania
Agriculture • agricultural households <1ha represents 44% of total, but less than 8% of the total area • 50% of the private individual farms have 1-10 ha, and only 2.19% have 10-50 ha • For the farms with legal status, the size category 1-10 ha, represents less than one third of the total number, less than 20% are between 10 and 100 ha, while the last category accounting farms with more than 100 ha has over 40% of total and covers more than 95% of the total area
Table 1 - Number of farms by size classes and area in hectares, 2007
Agriculture - size • The farms with less than one hectare that do not qualify for direct payments amount 1.684.078 private farms and 1.422 farms with legal status covering an area of 649.530 ha • The total number of farms having more than 1 ha is 2.150.329 • Over three years, from 2007 to 2009, the total number of direct payments decreased by 108.328 farms out of which 96.259 households of less than 5 ha
Agriculture - size • In 2010, 354.317 holdings belonged to the SSH category of 2-8 ESU. • Out of those, 147.554 households are headed by people of 65 years of age or more. • At the same time, the households with less than 2 ESU amount 3.871.242 among which 1.659.739 are owned by persons of 65 years and above.
Agriculture - farms • The physical size of the farms could be of less relevance, especially for the relatively small ones, as the production type and the level of production intensification can change the economic size of farms. • Related to the property aspects, over 90% of the total land area is registered into ownership and about 8% covers different forms of rent. About 1/3 of this area under rent is given free of any charge for farming
Agriculture - farms • Without the certitude of the pre-accession effects mainly given the lack of coherence in agricultural policy before and during that time horizon, 324.802 farms, with or without legal status, disappeared during two years before the accession moment
Agriculture - people • Out of the total employment, 9.369 thousand people, almost one fourth (2,22 million) are represented by farmers and qualified workers in agriculture, forestry and fishery • 40% of active people in agriculture have 55 years or over • 286.339 people were released from the farming activity, 97% of them being former temporary employees. The largest part of these came from the farms with less than 10 ha, and the effect was four times higher for the class 1-10 ha than for the class with less than 1 ha
Agriculture - people • Total number of farms - 3.931.350, • 99,54% in individual private farms and 0,45% in farms with legal status, • Represented a work place for 6.467.571 people, 98,92% on individual private farms and 1% on farms with legal status.
Agriculture - people • A total of 4.716.969 people had the status of employees: • 4.645.202 temporary employees (98,47%), • 52.975 permanent employees (1,12%) and • 18.792 farm heads (0,39%). • This situation allows the consideration of 71.767 work places as permanent employment, which represents only 1,5% of the total employment in the agricultural sector
Agriculture - expenditure • In terms of expenditure and self-consumption, in national average the employees have a share of 92% cash expenditure in their total expenses structure while the farmers only amount 52,7%, the rest of 47,3% being represented be the equivalent self-consumption • 3.172.280 households are consuming more than half of their own production representing 80,7% of total holdings. At the same time 2.621.860 households (or 85,6%) consuming more than 50% of their production have less than 1 ESU
Semi-subsistence • Based on household characteristics, farm characteristics, behavioural characteristics, characteristics of the external environment and viability, the major types of semi-subsistence households are: • Rural diversifiers, • Rural pensioners, • Farmers, • Rural newcomers. The five characteristics are supported by 72 variables
Semi-subsistence • Rural diversifiers have the highest level of formal education, the highest absolute annual non-farm income, and the highest share of non-farm income in household net income (65.8%). The agricultural production is 2/3 self-consumed having the lowest the share of farm net income in household net income (16.7%). Among the four types, the rural diversifiers have the largest number of produced agricultural goods with the smallest level of purchased inputs in animal production.
Semi-subsistence • Rural pensioners have the highest age of the household head and a long experience in managing the farm low formal education. They have the lowest farm net income and also the lowest annual household net income. Almost 2/3 of their production is self-consumed. The households are the smallest farms both in economic size and cultivated agricultural area. 2/3 of the products are issued by the animal production and the usage of purchased inputs is the highest.
Semi-subsistence • The farmers have the highest level of agricultural qualification and a high experience in managing the farm. The share of farm net income in household net income is by 1/3 higher than previous two categories. The absolute farm net income is the highest of the sample. The commercial orientation of the household is proved by the lowest share of own used agricultural production in total agricultural production.
Semi-subsistence • The farmers… more than 1/5 of these households are headed by women. The farms are the largest in both, economic size and agricultural area. These households have the highest share of crop production in total agricultural production and a low number of agricultural products (10 products). Moreover, they achieve the highest yields cereals. With a low use of purchased inputs for animal production per unit of animal production, these households also achieve the highest milk performance
Semi-subsistence • Rural newcomers have the lowest age among the farm operators, the least experience in managing the farm and the lowest level of formal education. They produce mainly for the market and have a low share of own used agricultural production in total agricultural production, while the share of farm net income in household net income is high. These households have the lowest household's cash balance of all, indicating the lack of ability to derive sufficient income from farming or from other income sources.
Semi-subsistence / policy support • The National Rural Development Programme in Romania allocates as public expenditure 476.077.390 Euro and establishes as achievement indicator to support 76.172 semi-subsistence farms, wrongly as a maximum of 63.477 SSH can be financed out of that amount • Until October 2011, 34.501 projects in total were approved for financing for a total amount of 258.757.500 Euro
Conclusions • Semi-subsistence households have the flexibilityto slightly increase their production level • Policy support in favor of commercial conversionof SSH in not effective or not in place • The educationlevel of the SSH heads is poor and their management is based mainly on practical experience
Conclusions • The smallest farms (bellow 10 ha) act as a growth reservoir, generally, but also for those moving out of semi-subsistence • A slighttransition from semi-subsistence to commercial dimensions is expected under the current conditions and the Romanian specificities, however not due to the policy instruments intervention
Conclusions • The social dimension of the subsistence and semi-subsistence are part of the agri-culture and should also be treated as a social value instead of transferring it completely from EAFRD to ESF