Download
1 / 1
20 likes | 167 Views
Studying Fruit Flies. Laura Chan, Kathlene Macaraeg, Leela Gill, Arisa Kawabata, Michael De Guzman, Christine Tsai Bio Technology, Hinojoza, James Logan High School.

E N D
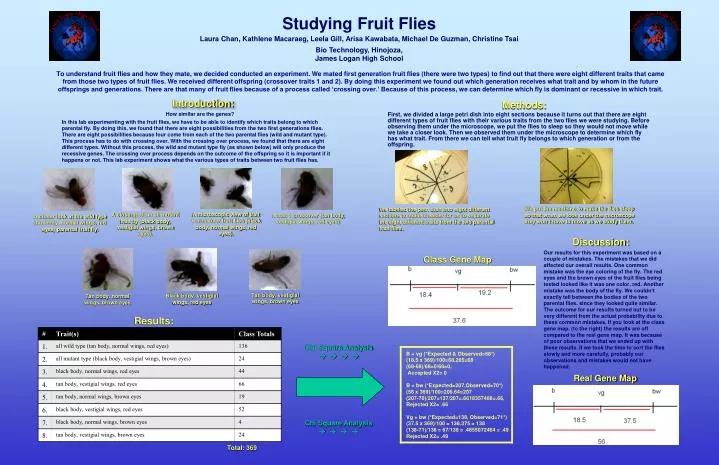
Studying Fruit Flies Laura Chan, Kathlene Macaraeg, Leela Gill, Arisa Kawabata, Michael De Guzman, Christine Tsai Bio Technology, Hinojoza, James Logan High School To understand fruit flies and how they mate, we decided conducted an experiment. We mated first generation fruit flies (there were two types) to find out that there were eight different traits that came from those two types of fruit flies. We received different offspring (crossover traits 1 and 2). By doing this experiment we found out which generation receives what trait and by whom in the future offsprings and generations. There are that many of fruit flies because of a process called ‘crossing over.’ Because of this process, we can determine which fly is dominant or recessive in which trait. Introduction: Methods: How similar are the genes? In this lab experimenting with the fruit flies, we have to be able to identify which traits belong to which parental fly. By doing this, we found that there are eight possibilities from the two first generations flies. There are eight possibilities because four come from each of the two parental flies (wild and mutant type). This process has to do with crossing over. With the crossing over process, we found that there are eight different types. Without this process, the wild and mutant type fly (as shown below) will only produce the recessive genes. The crossing over process depends on the outcome of the offspring so it is important if it happens or not. This lab experiment shows what the various types of traits between two fruit flies has. First, we divided a large petri dish into eight sections because it turns out that there are eight different types of fruit flies with their various traits from the two flies we were studying. Before observing them under the microscope, we put the flies to sleep so they would not move while we take a closer look. Then we observed them under the microscope to determine which fly has what trait. From there we can tell what fruit fly belongs to which generation or from the offspring. We put the medicine to make the flies sleep so that when we look under the microscope they won’t have to move as we study them. We labeled the petri dish into eight different sections to make it easier for us to separate the eight different traits from the two parental fruit flies. A microscopic view of trait 1 crossover fruit flies (black body, normal wings, red eyes). A close-up of an all mutant fruit fly (black body, vestigial wings, brown eyes). A trait 1 crossover (tan body, vestigial wings, red eyes). A closer look at the wild type (tan body, normal wings, red eyes) parental fruit fly. Discussion: Our results for this experiment was based on a couple of mistakes. The mistakes that we did affected our overall results. One common mistake was the eye coloring of the fly. The red eyes and the brown eyes of the fruit flies being tested looked like it was one color, red. Another mistake was the body of the fly. We couldn’t exactly tell between the bodies of the two parental flies. since they looked quite similar. The outcome for our results turned out to be very different from the actual probability due to these common mistakes. If you look at the class gene map, (to the right) the results are off compared to the real gene map. It was because of poor observations that we ended up with these results. If we took the time to sort the flies slowly and more carefully, probably our observations and mistakes would not have happened. Class Gene Map Tan body, vestigial wings, brown eyes Black body, vestigial wings, red eyes Tan body, normal wings, brown eyes Results: Chi Square Analysis B + vg (*Expected & Observed=68*) (18.5 x 369)/100=68.265=68 (68-68)/68=0/68=0, Accepted X2= 0 B + bw (*Expected=207,Observed=70*) (56 x 369)/100=206.64=207 (207-70)/207=137/207=.6618357488=.66, Rejected X2= .66 Vg + bw (*Expected=138, Observed=71*) (37.5 x 369)/100 = 138.375 = 138 (138-71)/138 = 67/138 = .4855072464 = .49 Rejected X2= .49 Real Gene Map Chi Square Analysis Total: 369