Download
1 / 9
90 likes | 235 Views
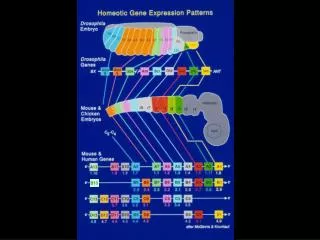
GEPAS Gene Expression Pattern Analysis Suite. Ka-Lok Ng Dept. of Bioinformatics Asia University. Prepare a text file with tab delimiter Line starts with ‘#’ denotes comment http://gepas.bioinfo.cipf.es/

E N D
GEPASGene Expression Pattern Analysis Suite Ka-Lok Ng Dept. of Bioinformatics Asia University
Prepare a text file with tab delimiter • Line starts with ‘#’ denotes comment • http://gepas.bioinfo.cipf.es/ • Tools clustering choose SOTA upload the text file decide the threshold, i.e. 80% RUN • To view the tree click ‘send to SotaTree’ default parameters RUN
Clusters information Click to view the profile
Profile – horiz. & vert. large scale • Cluster 3
Diauxic data • http://gepas3.bioinfo.cipf.es/cgi-bin/sets/diauxic
Diauxic data • Tools clustering choose SOTA upload the text file decide the threshold, i.e. 90% RUN • To view the tree click ‘send to SotaTree’ default parameters RUN Click on the cluster 6, it has 108 elements
Extract cluster 6 - PlotCorr • column 1 vs column 2 Threshold = 0.0 Threshold = 0.2
Extract cluster 6 – TreeView Tree width = 2200