Download
1 / 14
140 likes | 245 Views
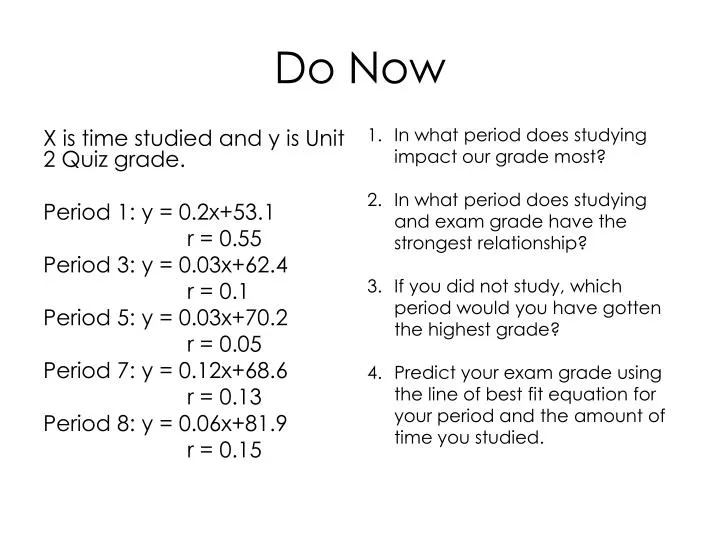
Do Now. In what period does studying impact our grade most? In what period does studying and exam grade have the strongest relationship? If you did not study, which period would you have gotten the highest grade?

E N D
Do Now In what period does studying impact our grade most? In what period does studying and exam grade have the strongest relationship? If you did not study, which period would you have gotten the highest grade? Predict your exam grade using the line of best fit equation for your period and the amount of time you studied. X is time studied and y is Unit 2 Quiz grade. Period 1: y = 0.2x+53.1 r = 0.55 Period 3: y = 0.03x+62.4 r = 0.1 Period 5: y = 0.03x+70.2 r = 0.05 Period 7: y = 0.12x+68.6 r = 0.13 Period 8: y = 0.06x+81.9 r = 0.15
Do Now: Interpret the slope and y-intercept. The following linear regression line is given for a boy collecting cards: Y = 4x + 10 where y is the total number of cards he has and x is each day after he started his collection.
Linear Regression Unit 2: Bivariate Data
Objective • SWBAT use a regression line to make predictions
Regression Line Regression line: describes how a response variable y changes as an explanatory variable x changes = ax + b Interpret slope: As x increases by 1, y increases by the slope (m). Interpret y-intercept: When x is 0, y is the y-intercept (b). * The stronger the correlation, the more accurate the prediction.
What is the relationship between price and sales of MK bags? • Interpret the slope and y-intercept of the graph. • MK is coming out with a new bag that will cost $250. How many of the bags can they expect to sell? • How accurate is this prediction based on the strength of the relationship?
Extrapolation Extrapolation: the use of a regression line for prediction far outside the interval of values of the explanatory variable x used to obtain the line. Such predictions are often not accurate.
What is the relationship between price and sales of MK bags? • If MK manufactured a $10 bag, how many could we expect to sell according to the regression line? • What factors might cause this extrapolation to be inaccurate?
Exit Ticket An ice cream shop records daily temperatures and ice cream sales in dollars all summer long. The temperature that summer never fell below 65 degrees. They have calculated the following linear regression equation: Ice cream sales = 5 (Daily temperature) + 20 The y-intercept can be interpreted as: a. When it is 0 degrees outside, ice cream sales will be $5.00. b. When it is 0 degrees outside, ice cream sales will be $20.00. c. When ice cream sales are $0, it will be 20 degrees. d. When ice cream sales are $0, it will be 5 degrees. 2. The slope can be interpreted as: a. With an increase of one degree, ice cream sales increase $20. b. With an increase of one degree, ice cream sales increase $5. c. With an increase of one ice cream sale, temperature increases 5 degrees. d. With an increase of one ice cream sale, temperature increases 20 degrees. 3. Predict the ice cream sales for a day with a temperature of 60 degrees. a. $300 b. $320 c. $56 d. 60$ 4. Would it be appropriate to predict the ice cream sale for a 32 degree day? a. Yes b. No