Download
1 / 33
330 likes | 507 Views
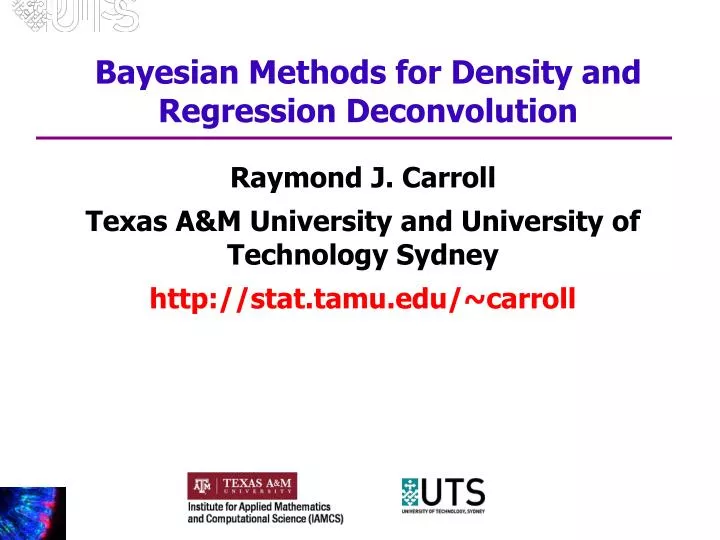
Bayesian Methods for Density and Regression Deconvolution. Raymond J. Carroll Texas A&M University and University of Technology Sydney http://stat.tamu.edu/~carroll. Co-Authors. Bani Mallick Abhra Sarkar . John Staudenmayer Debdeep Pati .

E N D
Bayesian Methods for Density and Regression Deconvolution Raymond J. Carroll Texas A&M University and University of Technology Sydney http://stat.tamu.edu/~carroll
Co-Authors BaniMallick Abhra Sarkar John Staudenmayer Debdeep Pati
Longtime Collaborators in Deconvolution Peter Hall Aurore Delaigle Len Stefanski
Overview • My main application interest is in nutrition • Nutritional intake is necessarily multivariate • Smart nutritionists have recognized that in cancers, it is the patterns of nutrition that matter, not single causes such as saturated fat • To affect public health practice, nutritionists have developed scores that characterize how well one eats • Healthy Eating Index, Dash score, Mediterranean score, etc.
Overview • One day of French fries/Chips will not kill you • It is your long-term average pattern that is important • In population public health science, long term averages cannot be measured • The best you can get is some version of self-report, e.g., multiple 24 hour recalls • This fact has been the driver behind much of measurement error modeling, especially including density deconvolution
Overview • Analysis is complicated by the fact that on a given day, people will not consume certain foods, e.g., whole grains, legumes, etc. • My long term goal has been to develop methods that take into account measurement error, the multivariate nature of nutrition, and excess zeros.
Why it Matters • What % of kids U.S. have alarmingly bad diets? • Ignore measurement error, 28% • Account for it, 8% • What are the relative rates of colon cancer for those with a HEI score of 70 versus those with 40? • Ignore measurement error, decrease 10% • Account for it, decrease 35%
Overview • We have perfectly serviceable and practical methods that involve transformations, random effects, latent variables and measurement errors • The methods are widely and internationally used in nutritional surveillance and nutritional epidemiology • For the multivariate case, computation is “Bayesian” • Eventually though, anything random is assumed to be Gaussian • Can we not do better?
Background • In the classical measurement error – deconvolution problem, there is a variable, X, that is not observable • Instead, a proxy for it, W, is observed • In the density problem, the goal is to estimate the density of X using only observations on W • Also, in population science contexts, the distribution of X given covariates Z is also important (very small literature on this)
Background • In the regression problem, there is a response Y • One goal is to estimate E(Y | X) • Another goal is to estimate the distribution of Y given X, because variances are not always nuisance parameters
Background • In the classic problem, W = X + U, with U independent on X. • Deconvoluting kernel methods that result in consistent estimation of the density of X were discovered in 1988 (Stefanski, Hall, Fan and ) • They are kernel density estimates with kernel function
Background • In the classic problem, W = X + U, with Uindependentof X. • The deconvoluting kernel is a corrected score for a ordinary kernel density function, with the property that for a bandwidth h, • Lots of results on rates of convergence, etc.
Background • There is an R package called decon • However, a paper to appear by A. Delaigle discusses problems with the package’s bandwidth selectors • Her web site has Matlab code for cases that the measurement error is independent of X, including bandwidth selection
Problem Considered Here • Here is a general class of models. Here are W and X • The W’s are independent given X
Background • There is a substantial econometric literature on technical conditions for identification in many different contexts (S. Schennach, X. Chen, Y. Hu) • The problem I have stated is known to be nonparametrically identified if there are 3 replicates (and certain technical completeness assumptions hold)
Problem Considered Here • Here is a general class of models, First, Y • The classical heteroscedastic model where the variance is important • Identified if there are 2 replicate W’s
Background • The econometric literature invariably uses sieves with orthogonal basis functions • The theory follows X. Shen’s 1997 paper
Background • In practice, as with non-penalized splines, 5-7 basis functions are used to represent all densities and functions • Constraints (such as being positive and integrating to 1 for densities) are often ignored • In the problem I eventually want to solve, the dimension of the two densities = 19 (latent stuff all around • Maybe use multivariate Hermite series?
Problem Considered Here • There is no deconvoluting kernel method that does density or regression deconvolution in the context that the distribution of the measurement error depends on X
Problem Considered Here • It seems to me that there are two ways to handle this problem in general • Sieves be an econometrician • Bayesian with flexible models • Our methodology is explicitly Bayesian, but borrows basis function ideas from the sieve approach
Model Formulation • We borrow from Hu and Schennach’s example and also Staudenmayer, Ruppert and Buonaccorsi • Here, U is assumed independent of X • Also, e is independent of X
Model Formulation • Our model is • Like previous authors, we model as B-splines with positive coefficients • We model as B-spline • As frequentists, we could model the densities of X, U, and e by sieves, and appeal to Hu and Schennach for theory • We have not investigated this
Model Formulation • Our model is • As Bayesians, we have modeled the densities of X, U, and e by DPMM • We have found that mixtures of normals, with an unknown number of components, is much faster, just as effective, and very stable numerically
Model Formulation • We found that by fixing the number of components to a largish number works best • The method concentrates on a lower number of components (Rousseau and Mengersen found this in a non-measurement error context) • There are lots of issues involved: (a) starting values; (b) hyper-parameters; (c) MH candidates; (d) constraints (e.g., zero means), (e) data standardization, etc.
Model Formulation • Here is a simulation example of density deconvolution and homoscedasticity with a mixture of normals for X and a Laplace for U • The settings come from a paper not by us • There are 3 replicates, so the density of U is also estimated by our method (we let DKDE know the truth) • I ran our R code as is, with no fine tuning
Model Formulation • Here is another example • Y = sodium intake as measured by a food frequency questionnaire (known to be biased) • W = same thing, but measured by a 24 hour recall (known to be almost unbiased) • We have R code for this
Model Formulation The dashed line is the Y=X line, indicating the bias of the FFQ
Multivariate Deconvolution • There are also multivariate problems of density deconvolution • We have found 4 papers about this • 3 deconvoluting kernel papers, all assume the density of the measurement errors is known • 1 of those papers has a bandwidth selector • Bovy et al (2011, AoAS) model X as a mixture of normals, and assume U is independent of X and Gaussian with known covariance matrix. They use an EM algorithm.
Multivariate Deconvolution • We have generalized our 1-dimension deconvolution approach as • Again, X is a mixture of multivariate normals, as is U • However, standard multivariate inverse Wishart computations fail miserably
Multivariate Deconvolution • We have generalized our 1-dimension deconvolution approach as • We use a factor analyticrepresentation of the component specific covariance matrices with sparsity inducing shrinkage priors on the factor loading matrices (A. Bhattacharya and D. Dunson) • This is crucial in flexibly lowering the dimension of the covariance matrices
Multivariate Deconvolution Multivariate inverse Wisharts on top, Latent factor model on bottom Blue = MIW, green = MLFA. Variables are (a) carbs; (b) fiber; (c) protein and (d) potassium
Conclusion • I still want to get to my problem of multiple nutrients/foods, excess zeros and measurement error • Dimension reduction and flexible models seem a practical way to go • Final point: for health risk estimation and nutritional surveillance, only a 1-dimensional summary is needed, hence better rates of convergence