Download
1 / 40
400 likes | 509 Views
The Obesity Epidemic: Implications for Public Schools. Josephine Connolly, MS, RD, Clinical Assist. Prof, Stony Brook University. The obesity epidemic is . a social problem affects children’s health and ability to learn has economic implications a sociological problem

E N D
The Obesity Epidemic: Implications for Public Schools Josephine Connolly, MS, RD, Clinical Assist. Prof, Stony Brook University
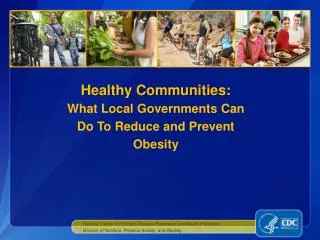
The obesity epidemic is ... • a social problem • affects children’s health and ability to learn • has economic implications • a sociological problem • is largely produced secondary to social structures
Obesity and Nutrition – Implications for Learning • micronutrient deficiencies • blood sugar changes and behavior • dieting practices - skipping meals • sleep apnea • consequences of taking medication for diabetes, high blood pressure or high cholesterol
Nutritional Status & Cognitive Function • Poor nutritional status affects cognitive development • Low iron, zinc and protein intakes • Low omega-3 polyunsaturated fat intake • Iron deficiency associated with lower scores on standardized math tests • Foods associated with obesity (sweetened beverages and candy, chips and sweets) not high in micronutrients…. Some obese children may also be poorly nourished • Obesity associated with inappropriate dieting practices among children, i.e. skipping meals Halterman, J.S. Pediatrics 2001 107(6):1381-1386
Pounds per Person A 30% Increase Year www.cspinet.org
Sugar Content of Popular Foods FOODTSP “% Daily Value” Snickers bar, 2.1 oz. 5¾ 58 TastyKake Honey Bun, 3¼ oz. 6 60 Lowfat fruit-flavored yogurt, 8 oz. 7 70 Pepsi, 12 oz. 10¼ 103 Pancake syrup, ¼ cup 10¼ 103 Hostess Lemon Fruit Pie, 4½ oz. 11½ 115 Strawberry Passion Awareness Fruitopia, 20 oz. 17¾ 178 Sources: Manufacturers, USDA, CSPI analyses and/or estimates. Center for Science in the Public Interest, August, 1999
Sleep Apnea in Children • Childhood sleep disordered breathing or sleep apnea associated with poor school performance • Obesity increases risk for sleep disordered breathing in children >8 years old • Chervin, et al., School performance, race and other correlates of sleep-disordered breathing in children., Sleep Medicine, 2003:4(1);21-27.
In General... • Headaches, stomach upsets and general malaise likely associated with nutritional status • “Studies continue to confirm that when children’s and adolescents’ basic nutritional and fitness needs are met, they learn better.” (David Satcher, Surgeon General Oct 2002)
No Data <10% 10%–14% Obesity Trends* Among U.S. AdultsBRFSS, 1985 (*BMI ≥30, or ~ 30 lbs overweight for 5’ 4” woman)
No Data <10% 10%–14% Obesity Trends* Among U.S. AdultsBRFSS, 1986 (*BMI ≥30, or ~ 30 lbs overweight for 5’ 4” woman)
No Data <10% 10%–14% Obesity Trends* Among U.S. AdultsBRFSS, 1987 (*BMI ≥30, or ~ 30 lbs overweight for 5’ 4” woman)
No Data <10% 10%–14% Obesity Trends* Among U.S. AdultsBRFSS, 1988 (*BMI ≥30, or ~ 30 lbs overweight for 5’ 4” woman)
No Data <10% 10%–14% Obesity Trends* Among U.S. AdultsBRFSS, 1989 (*BMI ≥30, or ~ 30 lbs overweight for 5’ 4” woman)
No Data <10% 10%–14% Obesity Trends* Among U.S. AdultsBRFSS, 1990 (*BMI ≥30, or ~ 30 lbs overweight for 5’ 4” woman)
No Data <10% 10%–14% 15%–19% Obesity Trends* Among U.S. AdultsBRFSS, 1991 (*BMI ≥30, or ~ 30 lbs overweight for 5’ 4” woman)
No Data <10% 10%–14% 15%–19% Obesity Trends* Among U.S. AdultsBRFSS, 1992 (*BMI ≥30, or ~ 30 lbs overweight for 5’ 4” woman)
No Data <10% 10%–14% 15%–19% Obesity Trends* Among U.S. AdultsBRFSS, 1993 (*BMI ≥30, or ~ 30 lbs overweight for 5’ 4” woman)
No Data <10% 10%–14% 15%–19% Obesity Trends* Among U.S. AdultsBRFSS, 1994 (*BMI ≥30, or ~ 30 lbs overweight for 5’ 4” woman)
No Data <10% 10%–14% 15%–19% Obesity Trends* Among U.S. AdultsBRFSS, 1995 (*BMI ≥30, or ~ 30 lbs overweight for 5’ 4” woman)
No Data <10% 10%–14% 15%–19% Obesity Trends* Among U.S. AdultsBRFSS, 1996 (*BMI ≥30, or ~ 30 lbs overweight for 5’ 4” woman)
No Data <10% 10%–14% 15%–19% ≥20 Obesity Trends* Among U.S. AdultsBRFSS, 1997 (*BMI ≥30, or ~ 30 lbs overweight for 5’ 4” woman)
No Data <10% 10%–14% 15%–19% ≥20 Obesity Trends* Among U.S. AdultsBRFSS, 1998 (*BMI ≥30, or ~ 30 lbs overweight for 5’ 4” woman)
No Data <10% 10%–14% 15%–19% ≥20 Obesity Trends* Among U.S. AdultsBRFSS, 1999 (*BMI ≥30, or ~ 30 lbs overweight for 5’ 4” woman)
No Data <10% 10%–14% 15%–19% ≥20 Obesity Trends* Among U.S. AdultsBRFSS, 2000 (*BMI ≥30, or ~ 30 lbs overweight for 5’ 4” woman)
Obesity Trends* Among U.S. AdultsBRFSS, 2001 (*BMI ≥30, or ~ 30 lbs overweight for 5’ 4” woman) No Data <10% 10%–14% 15%–19% 20%–24% ≥25%
Obesity Trends* Among U.S. AdultsBRFSS, 2002 (*BMI ≥30, or ~ 30 lbs overweight for 5’ 4” woman) No Data <10% 10%–14% 15%–19% 20%–24% ≥25% Source: Behavioral Risk Factor Surveillance System, CDC
Factors Contributing to Development of Obesity Individual Responsibility Environmental Issues
Societal Web Influencing the Prevalence of Obesity National Regional Community School Home Individual • Calorie Intake • Nutrient Composition • Type & Level of Physical Activity • Genetics • Public Transportation • Public Safety • Health Care • Local Agriculture • Culture • Media/ • Advertising • Food Industry • Transportation • Urbanization • Education • Food & Nutrition • Recommendations • Culture • Fund Raising • Food as Reward • % Free and Reduced • Physical Education/ Athletic Programs • Vending • A la carte • Amount of Cooking • Frequency of Fast or Convenience Foods • Activity Level • # TVs • Snacking Habits
Fat & Sugar Adds up Easily Recommended Sugar Max = 45 g 288 g Recommended Fat Max = 60 g 97 g
Cost of Obesity • U.S. obesity-attributable adult medical expenditures = $75 billion (2003) dollars • NY State = $ 6,080,000,000 (2nd highest) • About half financed by Medicare/Medicaid • Suspected implication – decreased state funds for other issues, i.e. education Finkelstein, EA, Obesity Research, January 2004
Goal - create a healthy culture conducive to learning Where Can We Go From Here? • Awareness campaigns • Faculty and staff • Community and parent level • Student level • Education programs • Social learning theory – goal is to change behavior • Policy development & implementation • Evaluation • Process • Impact • Outcome
Policy Topics • Nutrition education curriculum incorporated into the physical education program • Prohibition of the use of food as a reward • Establishment of uniform nutrition standards for all foods and beverages in the School District (including vending, school stores and fundraisers) • Move towards non-food related fundraising activities
Resource http://www.stonybrook.edu/heartlinks/