Download
1 / 17
170 likes | 289 Views
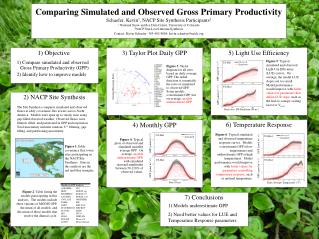
Comparing Simulated and Observed Gross Primary Productivity .

E N D
Comparing Simulated and Observed Gross Primary Productivity Kevin Schaefer, Altaf Arain, Alan Barr, Jing Chen, Ken Davis, Dimitre Dimitrov, Ni Golaz, Timothy Hilton, David Hollinger, Elyn Humphreys, Benjamin Poulter, Brett Raczka, Andrew Richardson, Alok Sahoo, Christopher Schwalm, Peter Thornton, Rodrigo Vargas, Hans Verbeeck, Chris Williams NACP Synthesis Management Team Ameriflux and Fluxnet Canada Investigators Modeling Team Investigators
Objectives • Quantify how well models simulate GPP • Identify sources of error
Model Runs Gap-filled observed weather Steady state Observed NEE partitioned into GPP & respiration GPP Uncertainty Random U* filtering Gap-filling Partitioning
Model-Data Comparison • Daily average GPP • Performance Measures • Chi-squared statistic • Root Mean Squared Error • Normalized Mean Absolute Error • Bias
Overall Model Performance Daily GPP Taylor Plot Standard Deviation Ratio GPP Ratio Optimized Model C5 C5.1 MODIS Model Mean
Typical GPP Observed Simulated Monthly Average GPP for CA-Ca1 GPP (mmol m-2 s-1) Date (Year)
Light Use Efficiency Curves Observed Simulated Daily AverageGPP for CA-Ca1 GPP (mmol m-2 s-1) Daily Average Shortwave Radiation (W m-2)
Temperature Response Curves Observed Simulated Daily Average GPP for CA-Ca1 GPP (mmol m-2 s-1) Daily Average Temperature (°C)
Conclusions • Models don’t simulate GPP well • Bias in seasonal amplitude • Improve LUE • Improve Temperature Response
Acknowledgments • Funding provided by NASA, NOAA, and NSF
Statistics C2~ 1 model matches data within uncertainty Chi-squared Root Mean Square Error RMSE = 0 perfect fit with data Normalized Mean Absolute Error NMAE = 0 perfect fit with data Bias B > 0 model greater than data
Ratio of Annual GPP Amplitude Percent Years (%) Simulated:Observed Amplitude Ratio (-)
GPP Total Uncertainty for CA-Ca1 GPP Uncertainty (mmol m-2 s-1) Date (year)
GPP Uncertainty for CA-Ca1 Daily Average GPP GPP Uncertainty (mmol m-2 s-1) Date (year)