Download
1 / 11
110 likes | 116 Views
More on Monte Carlo simulation in SR. GEOL/CE/EEB 8601 Intro to Stream Restoration. SEDIMENT TRANSPORT IN STREAM RESTORATION. Peter Wilcock Geography and Environmental Engineering National Center for Earth-surface Dynamics Johns Hopkins University. 19 September 2012.

E N D
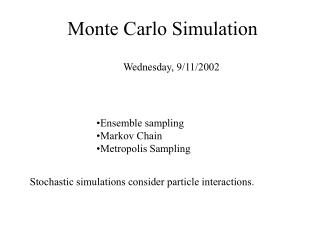
More on Monte Carlo simulation in SR GEOL/CE/EEB 8601 Intro to Stream Restoration
SEDIMENT TRANSPORT IN STREAM RESTORATION Peter WilcockGeography and Environmental EngineeringNational Center for Earth-surface DynamicsJohns Hopkins University 19 September 2012
Transport model for a threshold channel is based on a definition of incipient sediment motion Uncertainty Exercise For a simple, wide, prismatic channel, find critical discharge Qc for incipient motion continuity hydraulic geometry momentum Manning’s eqn.
What if you are not too sure about some of the values needed to determine Qc? Like n, D, andt*c –what do you do?
Suppose your best estimate of Manning’s n is 0.035and that you are pretty sure that the real value falls between 0.03 and 0.04. We could approximate your assessment of thevalue of n with a normal distribution with mean = 0.035 & standard deviation = 0.0025. 95% of this distribution falls between 0.03 and 0.04,as can be seen in the cumulative frequency plot, sowe are saying that the real value of n is 95% likely to fall between 0.03 and 0.04 and that it is more likely to be around the center of the distribution (0.035) than in the tails. We use this distribution to pick values of n in our Monte Carlo simulation. How does that work? We use a random number generator to pick a number between 0 and 1 and then use this number to find a value of n for the cumulative frequency distribution. For example, for 0.88, n = 0.0379for 0.23, n = 0.0332
1. The Monte Carlo simulation 1. Pick values of n, , and D from specified frequency distributions. 2. Calculate critical discharge and transport rate. 3. Repeat 1000 times. 4. Distribution of calculated values givesestimate of the effect of input uncertaintyon calculated critical discharge and transport rate. 2. 4. Monte Carlo
Estimating uncertainty in sediment transport It’s the input, not the formula !!! Mobile ChannelFind transport capacity for different water discharge Q Threshold Channel Find critical discharge Qc at which grain motion begins These terms have lots of uncertainty !!
2x 2x – 10x
No point being normal… • Log-normal: log(x) is normally distributed • Exponential: D(x) = 1 – e-kx
No point being normal… • Pareto:“long tail”
All types of distributions in Wikipedia http://en.wikipedia.org/wiki/Log-normal_distribution http://en.wikipedia.org/wiki/Weibull_distribution http://en.wikipedia.org/wiki/Exponential_distribution http://en.wikipedia.org/wiki/Gamma_distribution http://en.wikipedia.org/wiki/L%C3%A9vy_distribution http://en.wikipedia.org/wiki/Pareto_distribution http://en.wikipedia.org/wiki/Normal_distribution http://en.wikipedia.org/wiki/Uniform_distribution_(continuous) http://en.wikipedia.org/wiki/Uniform_distribution_(discrete) http://en.wikipedia.org/wiki/Poisson_distribution