Download
1 / 22
270 likes | 371 Views
A3 Reports. Aims & Objectives. Target Audience : Anyone who has to write a report or proposal Purpose of Module : To confirm understanding and benefits of A3 report writing to how to create one. Aims & Objectives : To confirm understanding of how to clarify thinking in a concise way

E N D
Aims & Objectives • Target Audience:Anyone who has to write a report or proposal • Purpose of Module :To confirm understanding and benefits of A3 report writing to how to create one. • Aims & Objectives : • To confirm understanding of how to clarify thinking in a concise way • To define a standard format for reports • To guide in the various steps in the creation of a report • To demonstrate the ability to create an A3
Course Agenda • Define a standard format for reports • Guide in the various steps in the creation of a report • To demonstrate the ability to create an A3
What is an A3 Report • A process used to document and report solutions to problems established within any area of the organisation. This differs from other types of report in the way that all information is disclosed on an A3 sheet. • Data being: • Aim • Objectives • Methodology • Result • Post result analysis • Learning points
Why A3 Report A3 Reports offer a simple and structured approach to reporting solutions to problems. A3 Reports are particularly effective in demonstrating to third parties the development stages of a fault, in reaching a solution. A3 Reports reveal the actions taken, or to be taken, in eradicating faults. A3 Reports reflect the benefits of implementing a particular methods to a problem, with the provision of justification. Essentially, A3 Reports leads to the identification & elimination of waste, in order to control processes.
80 / 20 Rule Summary Detail 5 w’s 1 h Proposal When writing the report remember the 80/20 rule! 20% • What • when • where • why • who • how 80%
Make it Easy to Read! If it’s difficult to read I’m not going to read it and you will not get what you want! Summary Summary Summary Detail 5 w’s 1 h Proposal
Show the Status if Report on Progress -on plan status Summary -away from plan with recovery action in place x -away from plan, no recovery in place Detail 5 w’s 1 h Proposal
How? Decide and construct your story Must satisfy your reader’s needs Visualise you’re A-3 *Does it tell a story? *Is it brief, concise? Decide type of A-3 Provide information to Support your story Determine your goal. What’s the purpose? Did we reach a conclusion? What’s the recommendation? Did we satisfy our goal? Analyze your information Charts, graphs
A3 Reports - Benefits • Helps define a standard for all to use. • Provides a clear and concise method of reporting information. • Method of operation is visible and accessible to all. • Can promote communication, and team working. • Leads to reduction of waste. • A continuous improvement activity. • Creates efficient working environment.
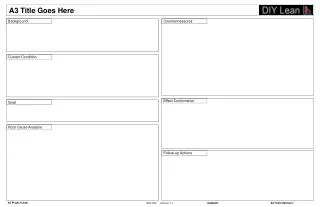
A3 Reports - Example TO: DATE: FROM: PROPOSAL STORY (replace this heading with your title) PROPOSAL, Cont’d THEME INTRODUCTION WHAT WHO WHEN _______________________________________________________________________________ _______________________________________________________________________________ _______________________________________________________________________________ PLAN PROPOSAL UNRESOLVED ISSUES
A3 Reports - Example WHAT WHO WHEN _______________________________________________________________________________ _______________________________________________________________________________ _______________________________________________________________________________ _______________________________________________________________________________ PROBLEM SOLVING REPORT STORY (replace this heading with your title) TO: DATE: FROM: THEME COUNTERMEASURES PROBLEM SITUATION IMPLEMENTATION TARGET/ GOAL CAUSE ANALYSIS FOLLOW-UP
A3 Reports - Example STATUS REPORT STORY (replace this heading with your title) TO: DATE: FROM: THEME TOTAL EFFECT BACKGROUND OBJECTIVES UNRESOLVED PROBLEMS/ FUTURE ACTIONS IMPLEMENTATION
A3 Reports - Example IMPLEMENTATION PLAN WHAT WHEN WHO INTRODUCTION Name: Plant: TO: DATE: FROM: PLANT LEARNINGS (Cont’d) PURPOSE OF VISIT PLANT LEARNINGS 11
A3 Reports - When to Use Them Anytime you wish to clearly tell a story, especially when You wish to simplify or clarify a complicated issue 12
A3 reports - Why? BECAUSE AN A-3 REPORT encourages…. • Logical Thinking – What/How to accomplish • Decision-Making – All facts on one page • Provides Standardised Method of Communication – is easy for to recognize and read • Forces Addressing of All Issues – any steps/facts left out? • Focuses Problem–Solving Activities – 5 Whys • Eliminates Waste – New methods help you think about waste and how it can be eliminated • Forces You to Ask: • Why do this? Does it make sense? • Will it improve the current process? Will it solve a problem?
A3 Reports - Why? A3 Reports - Why REDUCTION IN VARIATION • Standardised Format QUICK SET-UP • Standardised Format • Promotes quicker decision making LEAD TIME REDUCTION • Concise, clear communication • Easier to spot defects • Improves decision making ERROR PROOFING SMALL LOT STRATEGY • Reduces multi-page reports to one VISUAL CONTROLS • Standardised Format • A standardised approach to business communication • used to develop people PEOPLE • Eliminates waste • Lowers costs • Improves profits
A3 Reports - Summary • Plan time to grasp the ENTIRE situation • Decide what kind of story you need to tell • Relate the story to top company values, philosophies • Make your story flow in a logical sequence • Save words – use graphs and visuals • Make every word count
Example TU Date Issue Sign Ch.Eng.. Module: G.M/ MMT. H.O.L. Origin. Key Stakeholders. 1. Purpose of this module / element. 2.Benefits Definition: Helicopter view: 3. Proposal Step by step guides Detailed route map Simulations exercises Highlight on route map Experts to contact Standard formas Worked examples Exec. summary Memory joggers Training courses Case studies Glossary Elements Detailed view: 4. Potential issues and countermeasures 5. Reference documents:
Case Study Standard Work Sheet (SWS) CHANGEOVER TIME RUN A RUN B All Changeover Elements 50% Reduction RUN B EXT. RUN A Internal Leadtime / lot / part No. Additional 25% Reduction 100 parts A 100 parts A c/o 100 parts B c/o RUN A Internal RUN B EXT. QCO activities Additional 15% Reduction RUN A RUN B EXT. 50 parts A Qc/o 50 parts B Qc/o 50 parts A Qc/o 50 parts B Qc/o Internal Draw future state 7 Design future c/o process : 1 Document Current C/O Elements 2 Separate Internal / External Activities 8 Standardise & Document 7 Validate Procedure/Verify Results 6 Implement the Plan 80% Workplace Organization & Management 3 Shift Internal Activities to External 5 Streamline Internal/External Activities 10% Equipment 4 Locate Parallel Activities 4 Locate Parallel Activities Record new c/o times to visualise and sustain improvements 3 Shift Internal Activities to External 5 Streamline Internal/External Activities 2 Separate Internal and External Activities C/o Time 1 Document Current Changeover Elements 6 Implement the Plan 5% Tooling 5% Product Design 8 Document New Procedure on a SWS 7 Validate Procedure/Verify Results Current Test Date State Quick Changeover (QCO) Purpose Bring a batch production process as close as possible to a flow production process! Increase the flexibility of the process! Explanation/ How to proceed Draw current state 6 • Purpose: Display the actual situation in a standar- • dised way to to get a common understanding • of the problems or potential improvements. • Select the target area • Display the activities • Standardise the steps and the work content Implementation Steps What is QCO? 1 5 c/o process steps recorded • Select a production team and train the people in the new methods and their roles and resposibilities. • Select the target area • Document the current c/o Method ( Video, Spaghetti – Chart, Step Chart, Standardised Work Sheet ) • Develop the Future State. • Implement the Suggestions ( Activity Plan, Standardise the new situation, train the people ) • Monitor the success • Identify long term equipment modifications A standardised method for a production work group to analyse and significantly reduce set-up time. Change over time is the time between the last good part of one production run to the first good part of the Next Production run. An important influence on the QCO activities has the required process capacity to satisfy the customer demand in planned production time (Customer Takt ) Create a SWS for the current state to show workplace and and c/o process. Quick Change Over Method 4 • Draw current state • Show the waste (walking, transport, tooling storage etc.) • c/o Matrix: • To decide the target (i.e. Look at the red (difficult) c/o first) • Useful aid for production control in deciding the production sequence for different products • Result • Same volume produced • Leadtime/product cut in half. Products can be pulled by next process much earlier 2 Objectives Bring a batch production process as close possible to a flow production process • Future • Small lot sizes, frequent c/o • C/o done by operator • Standards for all c/o processes • Produce product on demand • Lower manufacturing costs • Traditionally • Big lot sizes, avoid c/o • C/o not done by operator but by maintenance people • No c/o planning • High inventory/long lead times • Draw future state • Waste removed (less walking, transport, tooling prepared in advance etc.) Considerations for future equipment planning 8 • During the planning phase for new equipment provide for quick and simple c/o. • Use o-point systems (Nullpunkt-Systeme) • Use common fixtures • Avoid threads in favor of quick release mechanisms Opportunities for improvement 3 Properties QCO integrates the c/o into the production responsibility Service Departments are involved by supporting the production in reaching their production targets. Overriding Metrics is the Production Performance. • Hints for implementation • QCO activities focus firstly on bottlenecks (determined by e.g. VSM on a large scale and by the c/o matrix on a smale scale) • All shifts have to be involved into the activities. • QCO has a significant impact on the traditional roles and responsibilities of production and service. Issues have to be solved before starting the module. • Relation to other – elements: * • Standardised Work • SPC • 5S – Visual Management • Logistics • TPM • VSD • Performance Measurables