Download
1 / 10
100 likes | 220 Views
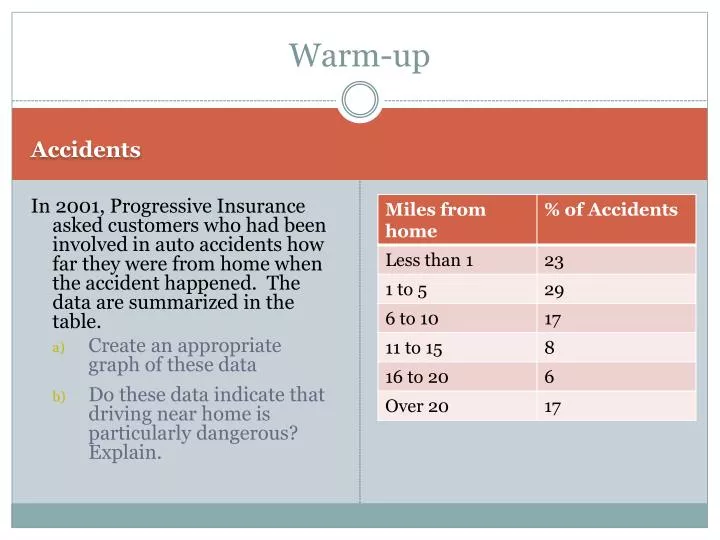
Warm-up. Accidents. In 2001, Progressive Insurance asked customers who had been involved in auto accidents how far they were from home when the accident happened. The data are summarized in the table. Create an appropriate graph of these data

E N D
Warm-up Accidents In 2001, Progressive Insurance asked customers who had been involved in auto accidents how far they were from home when the accident happened. The data are summarized in the table. • Create an appropriate graph of these data • Do these data indicate that driving near home is particularly dangerous? Explain.
Review questions • When describing a scatterplot, what four things should you always mention? • Direction, form, strength, unusual features (such as outliers, clusters) • What does correlation measure? • Measures the strength of the linear association between two quantitative variables • Explain the difference between association and correlation. • Association is a vague term describing the relationship between two variables. Correlation is a precise term describing the strength and direction of the linear relationship between quantitative variables
Review questions • What three conditions are necessary in order to use correlation as a measure of association? • Quantitative Variables condition • Straight Enough condition • Outlier Condition
Review questions • What does a correlation near zero indicate? • There is almost no linear association between the variables • Sketch an example of a scatterplot that shows two variables with a strong association but a weak correlation. • Is correlation resistant or nonresistant to outliers? Explain.
Review questions • A school board study found a moderately strong negative association between the number of hours high school seniors worked at part-time jobs after school hours and the students’ grade point averages. Explain in this context what “negative association” means. • Students who worked more hours tended to have lower grades
Correlation…more to think about… • Hoping to improve student performance, the school board passed a resolution urging parents to limit the number of hours students be allowed to work. Do you agree or disagree with the school board’s reasoning? Explain. • They are mistakenly attributing the association to cause and effect. “Association does not imply causation.” Maybe students with low grades are more likely to seek jobs, or maybe there is some other factor in their home life that leads both to lower grades and to the desire or need to work. (a lurking variable)
Demo: Effect of individual points on correlation http://bcs.whfreeman.com/ips4e/cat_010/applets/CorrelationRegression.html • Points near the center of the scatterplot have little effect • Points that fit the pattern increase the strength (and more so the farther the point is from the center) • Points that don’t fit the pattern decrease (and can even reverse the sign of ) the correlation
Re-expressing data to make it linear • The variables year and U.S. population, in millions of people are displayed. The association between year and population is strong, positive, and curved. Population has been increasing over the last 200 years. Furthermore, the rate of population growth has been increasing. The U.S. population has been growing faster in more recent years. We will attempt to straighten the scatter plot using a logarithmic re-expression and a square root re-expression.
Re-expressing data to make it linear Ex 1. Gordon Moore, one of the founders of Intel Corporation, predicted in 1965 that the number of transistors on an integrated circuit chip would double every 18 months. This is “Moore’s Law,” one way to measure the revolution in computing. Here are the data on the dates and number of transistor for Intel microprocessors.