Download
1 / 18
180 likes | 289 Views
Crescent Electric Sales Forecasting. A Summer Project by Intern Bo Anderson. www.cesco.com. How do you Forecast Sales?. Find variables outside company related to sales Outside company, economic factors Measure effect of variables on sales So X is ↑, do sales go ↑ or ↓? Adjust for company

E N D
Crescent Electric Sales Forecasting A Summer Project by Intern Bo Anderson www.cesco.com
How do you Forecast Sales? • Find variables outside company related to sales • Outside company, economic factors • Measure effect of variables on sales • So X is ↑, do sales go ↑ or ↓? • Adjust for company • Seasonality • Size of company (branches)
How do you find those variables? • Find ones that make logical sense • Find ones that trend with sales • Correlation • “the degree to which two or more attributes or measurements on the same group of elements show a tendency to vary together”
Correlation Types • Positive Correlation • If one thing goes up/down, so does the other • My weight goes up and so does my waist size. • Negative Correlation • If one thing goes up/down, the other does the opposite • I spend more time playing video games and my GPA goes down • No Correlation • If one thing goes up/down, the other doesn’t respond • I eat more cheetos but my shoe size stays the same
Correlation Examples Hypothetical Examples Left Shoe & Right Shoe Correlation = 1.0 # of Apples Person 1 & Person 2 if sharing Correlation = -1.0 Real Life Examples Unemployment Rate & # of Hires Correlation = -0.93 MLB 2011: Wins & Saves Correlation = -0.03
Regression • Linear Regression: • the relation between variables in an equation that measures how certain independent variables effect a dependent variable • Measure the effect of variables while holding “everything else constant” • Hand size & weight relationship, really it’s just height and weight • Must hold height constant to really see a relationship
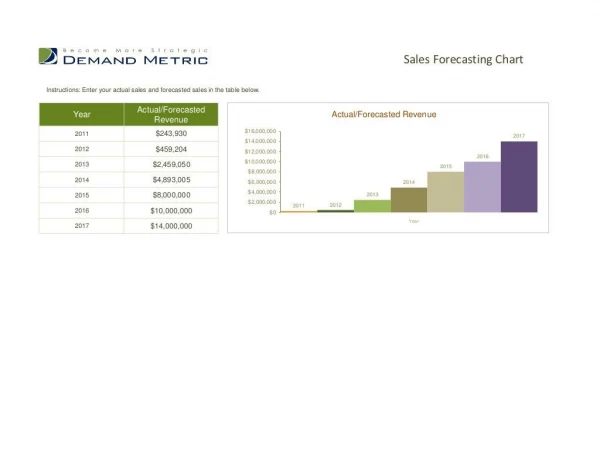
Let’s do our own Linear Regression What is the relationship between the Economy and Crescent’s Total Sales?
Real Private Nonresidental Investment • Measured in billions of 2005 dollars. This means it’s adjusted for inflation • Measures business investment purchases (buildings, inventory etc.) • The majority of our sales count under this
Real Personal Income Excluding Current Transfer Receipts • Measured in Billions of 2005 Dollars, meaning adjusted for inflation • Measures individuals ability to consume • Our customers livelyhood
# of Branches • Measured in… well branches. Closings and openings are adjusted by the year/quarter of change so decimals are used (Close in late June then .5 branches for year) • Help measure an increase in our available market
S&P Case-Shiller 20-City Home Price Index • Index with January of 2000 as a base of 100 • Increase in demand for a housing, means increases in complimentary products (ex: lights, wiring, etc.) • Type 1 Customers are effected by housing
All Employees: Goods Producing Industries • Measured in thousands of persons • As companies expand payrolls they’ll also be in a position to expand inventories and builidings
Our Model • Q1 Sales = - $35,2464,272.30 + ($46,758.22)*RPNFI + ($55,242.36)*SPCSHHPI + ($7,492.30)*AEGPI + ($32,962.60)*RPIECTR + ()*BranchesSeasonal Adjustments: Q2 + $29,606,440.82; Q3 + $36,307,769.30; Q4 + $29,550,914.42
How accurate is our Model? • 95% of the time it is within 3%. Once every 20 years it will be off by more • The odds of it being off are the same as the odds the Dallas Cowboys have to win the Super Bowl this year according to Vegas • Think about it the Cowyboys COULD win the Super Bowl, but we are pretty sure that won’t happen. if anybody wants to bet heads-up with 1 to 1 odds, I’ll take your bet right now