Download
1 / 37
380 likes | 503 Views
The Cleveland Clinic Foundation. Quantitative Microscopy and Micro-CT. by Kimerly A. Powell, Ph.D. Quantitative microscopy. Objective.

E N D
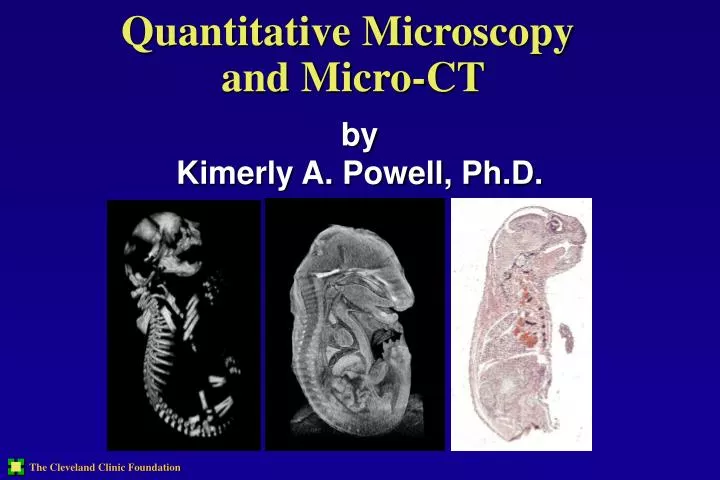
The Cleveland Clinic Foundation Quantitative Microscopy and Micro-CT by Kimerly A. Powell, Ph.D.
Objective To determine the quantitative morphometrics (i.e., number, size, orientation) of biological structures (i.e., cells, cell nuclei, collagen fibers) in an automated unbiased fashion.
Feature Analysis – Rat Tendon Collagen Fibrils Number fibrils = 247 Mean (s.d.) Area = 16701.32 (791.6) nm Range Area = [857.7 - 48203.3] nm Mean (s.d.) Diameter = 134.2 (57.0) nm Range Diameter = [33.0 - 247.7] nm
Mouse Alveolar Septae Width MAT overlayed EDM Histogram EDM image mean half-width = 8.3 (0.03) pixels mean width = 11.5 microns
Ncells = 189, 1.02 mm2, 10.2% density Ncolonies = 10 Mouse Bone Stem Cells – Colony Proliferation
Introduction - Micro-CT Imaging Micro-CT is a high resolution version of X-ray tomographic imaging (resolution = 10 - 100 microns). It has primarily been used to image ex vivo bone core specimens. And more recently been used to image various bone structures in vivo in small animal models.
Introduction –Micro-CT Imaging X-ray source Detector Object rotates • increased scanning speed • more efficient use of x-rays • reduced dose Cone-Beam Micro-CT
Image Intensifier & CCD camera X-ray Source Rotational Stage CCF Micro-CT Imaging System • 4 micron spot size X-ray • 10-225 kV, 0.01 - 0.3 mA • 3-field II (5, 7, 9 inch FOV) • 2k x 2k 12-bit CCD camera • 7 - axis positioning system
Micro-CT Imaging Applications • Bone trabecular morphometry • iliac crest, calcaneous, femoral head • Tissue engineering • Bone densityand location of new bone formationin HA and PCL bone tissue scaffolds • In-vivo small animal imaging • Longitudinal evaluation of callus and bone volume in in vivo bone fracture/healing model • Mouse Phenotyping • Morphometric analysis of skeletal structure in metalloprotease knockout mice
detector x-ray source Fracture Model - Image Acquisition resolution = 100 mm Projection radiograph Hind limbs secured in micro-CT system
A B C osteotomies Fracture Model – 3D Reconstructions Right leg Left leg
Registered Unregistered Fracture Model – Spatial Registration • Segment bone – global threshold • Find outer outlines • ICP registration • reference – prinicpal axis week 0 ROI Red = week 0 Yellow = week 5
F E B C D A Week 1 Week 0 Week 2 Week 5 Week 3 Week 4 Fracture Model - Morphometrics
Trabecular Architecture – In vivo imaging Trabecular morphometry Treatment therapies - PtH Proximal tibia rat
Mouse Phenotyping E18.5 WT mouse
A B C Application – Embryonic Development Alizarin red/Alcian Blue after staining E18.5 in ethanol
E12.5 E13.5 E14.5 E15.5 E16.5 E17.5 Application – Embryonic Development
E12.5 E13.5 E14.5 E15.5 E16.5 E17.5 Application – Embryonic Development
Soft Tissue Micro-CT Imaging – Rat Embryo (E18) cut plane heart liver intestines Side view Front view
Ex vivo Micro-CT Imaging of Mouse Skulls 2 week old Wild Type 2 week old MMP-14 KO
Application – Skull Morphometry Procrustes Analysis: • 3D Landmark Data • Separates Size from Shape 3D reconstruction rat skull
Inner Ear Foramen Magnum Teeth and pallette Application – Skull Morphometry M I S
Application – Vertebral Morphometry • Segment bone • Label separate objects • Separate ‘touching’ objects • Make linear and volumetric measurements on separated objects S1 S2 S3 Sacral spine of 2-week old WT mouse
Application – Vertebral Morphometry S2 S2 Spinous process verterbal foramen articular process transverse process 2 week old MMP-14 KO 2 week old Wild Type
secondary center of ossification Application – Tibia Morphometry growth plate trabeculae Internal micro-architecture of 2 week old mouse tibia resolution = 15 microns
Application – Skeletal Atlas • Automatically label individual bones in skeleton • Standardize measurements for individual bones
Acknowledgements Collaborators: Suneel Apte, MBBS D. Phil. Ron Midura, Ph.D. George Muschler, M.D. Don Stredney (OSC) Barry Kuban, B.S. Larry Latson, M.S. Craig Bennetts B.S. BME Prototype Lab Jason Bryan (OSC) NIH DOD