Download
1 / 63
640 likes | 664 Views
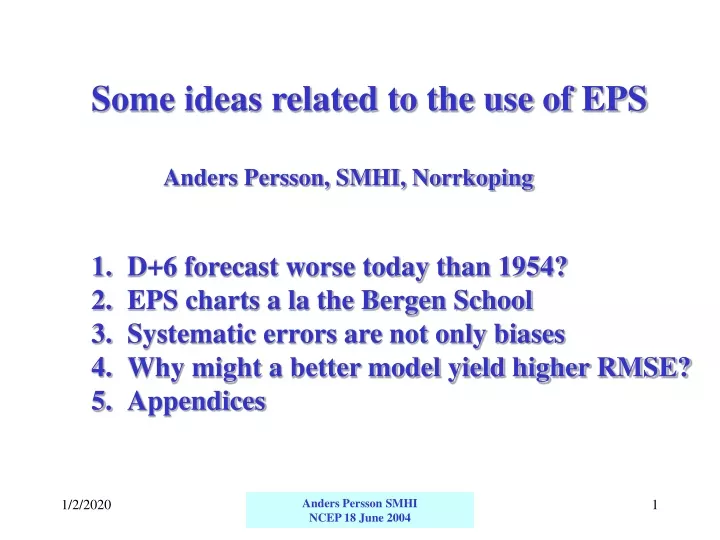
Some ideas related to the use of EPS Anders Persson, SMHI, Norrkoping D+6 forecast worse today than 1954? EPS charts a la the Bergen School Systematic errors are not only biases Why might a better model yield higher RMSE? Appendices. Some ideas related to the use of EPS

E N D
Some ideas related to the use of EPS • Anders Persson, SMHI, Norrkoping • D+6 forecast worse today than 1954? • EPS charts a la the Bergen School • Systematic errors are not only biases • Why might a better model yield higher RMSE? • Appendices Anders Persson SMHI NCEP 18 June 2004
Some ideas related to the use of EPS • Anders Persson, SMHI, Norrkoping • D+6 forecast worse today than 1954? • EPS charts a la the Bergen School • Systematic errors are not only biases • Why might a better model yield higher RMSE? • Appendices Anders Persson SMHI NCEP 18 June 2004
The pre-NWP forecast accuracy persistence A2 A schematic illustration of the increase of RMSE with forecast time. The pre-NWP forecaster started from a persistence forecast which he skillfully extrapolated into the future, converging towards climate for longer ranges meteorologist A • The time unit can be anything from hours to days depending on the parameter (hours for clouds, days for temperature) Anders Persson SMHI NCEP 18 June 2004
NWP more accurate - but also less persistence A2 world’s best NWP A good NWP model is able to simulate all atmospheric scales throughout the forecast. It has the same variance as the observations and the persistence forecasts, which yields an error saturation level 41% above the climate meteorologist A Anders Persson SMHI NCEP 18 June 2004
The art of good forecasting persistence A2 world’s best NWP The way out of the dilemma: Combine the high accuracy of NWP in the short range with a filtering of the non-predictable scales for longer ranges This can be done both with and without the EPS meteorologist A modified forecast Anders Persson SMHI NCEP 18 June 2004
Observed 2 m T error growth (Karlstad) error saturation level • The accuracy of different forecast methods for a city in central Sweden winter 2001-2002: persistence,climate,T511, an average of the last three days T511 (“poor man’s ensemble mean”)and the T255 EPS ensemble mean persistence T511 error level for climatological statements mean of last T511:s EPS ensemble mean • Forecast days Anders Persson SMHI NCEP 18 June 2004
But almost as important as forecast skill is forecast consistency Anders Persson SMHI NCEP 18 June 2004
Jumpiness in 2 m T forecasts (Karlstad) upper level for jumpiness • The ensemble mean is not only the most accurate, it is by far also the least “jumpy” • While the T511 makes an average 24 hour “jump” of 2 - 4°K, the T255 ensemble mean is stable at around 1° K error level for climatological statements T511 EPS ensemble mean • Forecast days Anders Persson SMHI NCEP 18 June 2004
Southern Sweden • The 24 h jumpiness for T511 and the T255 ensemble mean • Central Sweden Anders Persson SMHI NCEP 18 June 2004
Some ideas related to the use of EPS • Anders Persson, SMHI, Norrkoping • D+6 forecast worse today than 1954? • EPS charts a la the Bergen School • Systematic errors are not only biases • Why might a better model yield higher RMSE? • Appendices Anders Persson SMHI NCEP 18 June 2004
The EPS contains a lot of information, spread out in several locations One solution is to create ”synoptic” EPS maps in the old Bergen School tradition: combine several parameters in the same map! Anders Persson SMHI NCEP 18 June 2004
Probability of strong winds, precipitation and anomalous (850 hPa) temperatures 6 February 2001 D+5 Anders Persson SMHI NCEP 18 June 2004
Probability of strong winds, precipitation and anomalous (850 hPa) temperatures 6 February 2001 D+5 >10 m/s >15 m/s >5 mm/24t >1 mm/24t >10 mm/24t >20 mm/24t > + 8K < -8 K < -4 K > +4 K Anders Persson SMHI NCEP 18 June 2004
Probabilities that the 850 hPa temperature anomalies are >- 4 K or > + 4 K …and combine them with the ensemble mean map... Anders Persson SMHI NCEP 18 June 2004
…500 hPa 6 February 2001 +120 h Anders Persson SMHI NCEP 18 June 2004
…850 hPa temperature anomalies overlaid the ensemble mean 500 hPa 6 February 2001 + 120 h Anders Persson SMHI NCEP 18 June 2004
The same for gale force winds and precipitation according to EPS from 6 February 2001 + 120 h Vind > 15m/s Nbd >5 mm/24 t Anders Persson SMHI NCEP 18 June 2004
… in combination with the ensemble mean forecast Anders Persson SMHI NCEP 18 June 2004
… 6 February 2001 12 UTC + 120 h Prob > 15 m/s Prob > 5mm/24h Anders Persson SMHI NCEP 18 June 2004
The Synoptic EPS Map combines the mean and the spread Anders Persson SMHI NCEP 18 June 2004
A situation from 11 November 2001, which contained disturbances both in the north and south Anders Persson SMHI NCEP 18 June 2004
EPS forecast 4 Nov 2001 D+7 verifying 11 November Prob > 15 m/s Prob > 5mm/24h 1000 hPa geop. Anders Persson SMHI NCEP 18 June 2004
EPS forecast 5 Nov 2001 D+6 verifying 11 November Anders Persson SMHI NCEP 18 June 2004
EPS forecast 6 Nov 2001 D+5 verifying 11 November Anders Persson SMHI NCEP 18 June 2004
EPS forecast 7 Nov 2001 D+4 verifying 11 November Anders Persson SMHI NCEP 18 June 2004
EPS forecast 8 Nov 2001 D+3 verifying 11 November Anders Persson SMHI NCEP 18 June 2004
The increase in anomaly correlation coefficient of the EM of 2 m-temperature D+7 forecasts compared with different other deterministic methods (9 European stations) T511 T255 +2 +7 +8 Ensemble mean T255 +3 +4 +3 +3 Poor Man’s T511 Poor Man’s T255 +2 Anders Persson SMHI NCEP 18 June 2004
The best simulation of meteorological features The best forecasts 1-2 days ahead, but then worse Jumpy forecasts after 3-4 days Good geographical resolution Occasionally a bit unrealistic flow patterns The best categorical forecast values beyond 2 days Drastically reduced jumpiness The ensemble mean can be supplemented with probabilities, which is not possible with the T511 T511 forecasts compared with T255 ensemble mean valuesAdvantages with T511 The same for T255 ensemble mean values Anders Persson SMHI NCEP 18 June 2004
Some ideas related to the use of EPS • Anders Persson, SMHI, Norrkoping • D+6 forecast worse today than 1954? • EPS charts a la the Bergen School • Systematic errors are not only biases • Why might a better model yield higher RMSE? • Appendices Anders Persson SMHI NCEP 18 June 2004
Problem in the ECMEF EPS system: T255 Control Anders Persson SMHI NCEP 18 June 2004
Common problem in EPS systems:under-spread error spread Too much spread Too little spread +72h Anders Persson SMHI NCEP 18 June 2004
The T255 (and T511) have problems with temperatures below -25 C Range 20 K Too warm forecasts Anders Persson SMHI NCEP 18 June 2004
27 Dec 2002 Anders Persson SMHI NCEP 18 June 2004
The mean error (ME) decreased by 1-2 K but the RMSE only by 0.5 K The solution lies in the ensemble approach... 27 Dec 2002 Anders Persson SMHI NCEP 18 June 2004
Range 30 K Non-biased forecasts Anders Persson SMHI NCEP 18 June 2004
Principle of a two-dimensionel error equation Based on its “experience” of forecasts > -8 C the filter”sees” a certain linear relation between forecast and error Experience 21-29 October 2002 Anders Persson SMHI NCEP 18 June 2004
Principles of a two-dimensional error equation Based on “experiences” in the range > -8 C the filter i capable of producing corrections for much lower temperatures for which it has no direct “experience” Experience 21-29 Oct 2002 Extrapolation of regression line Anders Persson SMHI NCEP 18 June 2004
Principen för en två-dimensionell felekvation När verifikationen för temperatur-prognoserna under -8 C blir tillgängliga visar det sig att korektionerna var realistiska Erfarenhet 30 oktober - 6 november 2002 Anders Persson SMHI NCEP 18 June 2004
Ölands södra udde januari - mars 2004 Anders Persson SMHI NCEP 18 June 2004
Some ideas related to the use of EPS • Anders Persson, SMHI, Norrkoping • D+6 forecast worse today than 1954? • EPS charts a la the Bergen School • Systematic errors are not only biases • Why might a better model yield higher RMSE? • Appendices Anders Persson SMHI NCEP 18 June 2004
Understanding statistical interpretation and why better forecasts can look worse... Anders Persson SMHI NCEP 18 June 2004
HIRLAM-44 24 hour 2 m temperature forecast for Kiruna in Lapland winter 2001-2002 The verification yielded RMSE=5.0 Emean=2.6 Anders Persson SMHI NCEP 18 June 2004
A 1-dimensional Kalman filter can reduce an overall bias The corrections yielded a reduction of the RMSE from 5.0 to 4.2 and of the EMEAN from 2.6 to 0.2 But cooling the warm forecasts made the results worse Coolingthe cold forecasts improved the results Anders Persson SMHI NCEP 18 June 2004
A 2-dimensional Kalman filter can provide different corrections to different regimes. The cooling the cold forecasts did not affect the warm forecast Coolingthe cold forecasts still improved the results Anders Persson SMHI NCEP 18 June 2004
The Kalman filtering has reduced two systematic errors: a positive mean error and an underestimation of the variability The mean error is reduced from 2.6 to 0.3! HIRLAM variance 25 K Observed variance 40 K …but the RMSE is only reduced from 5.0 to 4.6 Anders Persson SMHI NCEP 18 June 2004
To show that what looks like equal improvements are not quite “equal”, we will make a simple manipulation of the data:the observations and the numerical forecasts are ”swopped” Anders Persson SMHI NCEP 18 June 2004
24 hour 2 m temperature forecast for Kiruna winter 2001-2002 - with observations and forecasts swopped ”obs” ”model” Anders Persson SMHI NCEP 18 June 2004
After Kalman filtering the EMEAN is reduced to zero and the RMSE is reduced from 5.0 to 2.9 Extreme cold “forecasts” warmed Anders Persson SMHI NCEP 18 June 2004
Anders Persson SMHI NCEP 18 June 2004
Some ideas related to the use of EPS • Anders Persson, SMHI, Norrkoping • D+6 forecast worse today than 1954? • EPS charts a la the Bergen School • Systematic errors are not only biases • Why might a better model yield higher RMSE? • Appendices Anders Persson SMHI NCEP 18 June 2004