Download
1 / 23
330 likes | 1.25k Views
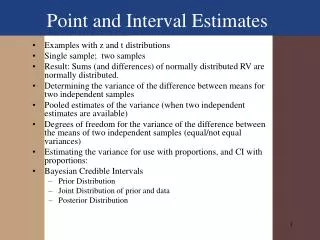
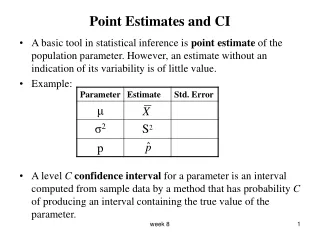
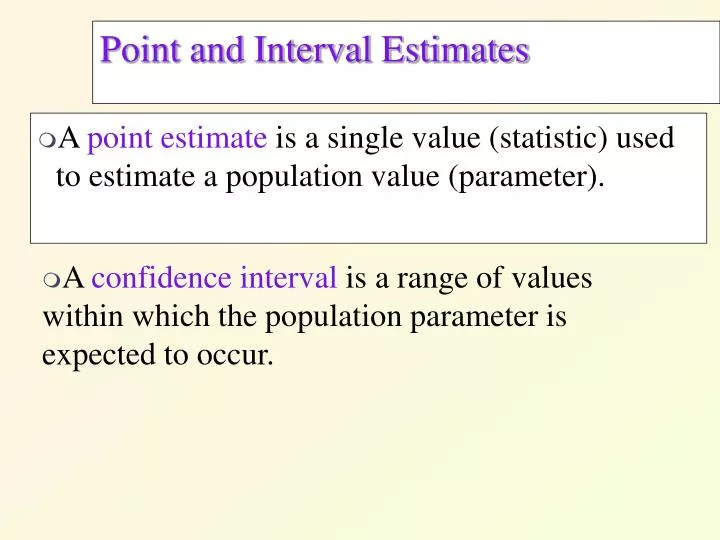
A point estimate is a single value (statistic) used to estimate a population value (parameter). . Point and Interval Estimates. A confidence interval is a range of values within which the population parameter is expected to occur. .

E N D
A point estimate is a single value (statistic) used to estimate a population value (parameter). Point and Interval Estimates • A confidence interval is a range of values within which the population parameter is expected to occur.
The factors that determine the width of a confidence interval are: 1. The sample size, n. 2. The variability in the population, usually estimated by s. 3. The desired level of confidence. Point Estimates and Interval Estimates
If the population standard deviation is known or the sample is greater than 30 we use the z distribution. Point and Interval Estimates
If the population standard deviation is unknown and the sample is less than 30 we use the t distribution. Point and Interval Estimates
An Interval Estimate states the range within which a population parameter probably lies. Interval Estimates • The interval within which a population parameter is expected to occur is called a confidence interval. • The two confidence intervals that are used extensively are the 95% and the 99%.
For a 95% confidence interval about 95% of the similarly constructed intervals will contain the parameter being estimated. Also 95% of the sample means for a specified sample size will lie within 1.96 standard deviations of the hypothesized population mean. Interval Estimates • For the 99% confidence interval, 99% of the sample means for a specified sample size will lie within 2.58 standard deviations of the hypothesized population mean.
The standard error of the sample mean is the standard deviation of the sampling distribution of the sample means. It is computed by is the symbol for the standard error of the sample mean.µ is the standard deviation of the population. n is the size of the sample. Standard Error of the Sample Means
If is not known and n30, the standard deviation of the sample, designateds, is used to approximate the population standard deviation. The formula for the standard error is: Standard Error of the Sample Means
The 95% and 99% confidence intervals for are constructed as follows when: 95% CI for the population mean is given by 95% and 99% Confidence Intervals for µ • 99% CI for the population mean is given by µ
In general, a confidence interval for the mean is computed by: Constructing General Confidence Intervals for µ
The Dean of the Business School wants to estimate the mean number of hours worked per week by students. A sample of 49 students showed a mean of 24 hours with a standard deviation of 4 hours. What is the population mean? EXAMPLE 3 • The value of the population mean is not known. Our best estimate of this value is the sample mean of 24.0 hours. This value is called a point estimate.
Find the 95 percent confidence interval for the population mean. Example 3 continued The confidence limits range from 22.88 to 25.12. About 95 percent of the similarly constructed intervals include the population parameter.
Moving from Ratio scale: measuring and comparing to a mean to Nominal Scale – mutually exclusive groups Confidence Interval for a Population Proportion • A company representative claims 45% of Burger King’s sales are made at the drive-through window • A recent survey of married men between the ages of 35 and 59 found that 63 % felt that both partners should earn a living.
The confidence interval for a population proportion is estimated by: Confidence Interval for a Population Proportion where p is the population proportion and the standard error is under the radical
A sample of 500 executives who own their own home revealed 175 planned to sell their homes and retire to Arizona. Develop a 98% confidence interval for the proportion of executives that plan to sell and move to Arizona. EXAMPLE 4
A population that has a fixed upper bound is said to be finite. For a finite population, where the total number of objects is N and the size of the sample is n, the following adjustment is made to the standard errors of the sample means and the proportion: Standard error of the sample means: Finite-Population Correction Factor
Standard error of the sample proportions: Finite-Population Correction Factor • This adjustment is called the finite-population correction factor. • If n/N < .05, the finite-population correction factor is ignored.
Given the information in EXAMPLE 4, construct a 95% confidenceinterval for the mean number of hours worked per week by the students if there are only 500 students on campus. Because n/N = 49/500 = .098 which is greater than 05, we use the finite population correction factor. EXAMPLE 5 • The Dean of the Business School wants to estimate the mean number of hours worked per week by students. A sample of 49 students showed a mean of 24 hours with a standard deviation of 4 hours..
There are 3 factors that determine the size of a sample, none of which has any direct relationship to the size of the population. They are: The degree of confidence selected. The maximum allowable error. The variation in the population. Selecting a Sample Size
To find the sample size for a variable: where : E is the allowable error, z is the z- value corresponding to the selected level of confidence, and s is the sample deviation of the pilot survey. Variation in the Population
A consumer group would like to estimate the mean monthly electricity charge for a single family house in July within $5 using a 99 percent level of confidence. Based on similar studies the standard deviation is estimated to be $20.00. How large a sample is required? EXAMPLE 6
The formula for determining the sample size in the case of a proportion is: wherep is the estimated proportion, based on past experience or a pilot survey; z is the z value associated with the degree of confidence selected; E is the maximum allowable error the researcher will tolerate. Sample Size for Proportions
The American Kennel Club wanted to estimate the proportion of children that have a dog as a pet. If the club wanted the estimate to be within 3% of the population proportion, how many children would they need to contact? Assume a 95% level of confidence and that the club estimated that 30% of the children have a dog as a pet. EXAMPLE 7