Download
1 / 16
160 likes | 288 Views
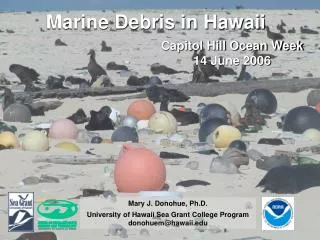
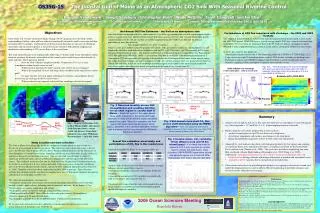
Marine planktonic communities from Hawaii Ocean Times Series Station (HOT/ALOHA ) Mark Anderson (University of Chicago) Ildiko Frank (UCSC) Yvonne Lipsewers (NIOZ, Netherlands ) Sara Cuadros Orellana ( CEBio , Brazil) Lise Øvreas (University of Bergen) Judy Wan (NASA).

E N D
Marine planktonic communities from Hawaii Ocean Times Series Station (HOT/ALOHA) Mark Anderson (University of Chicago) Ildiko Frank (UCSC) Yvonne Lipsewers (NIOZ, Netherlands) Sara Cuadros Orellana (CEBio, Brazil) LiseØvreas (University of Bergen) Judy Wan (NASA)
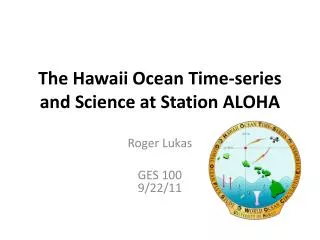
Time and location of sampling 22º45’, 158º 00’ W Oct 2002 – Dec 2003
Vertical profiles of physico-chemical parameters at the ALOHA Station
Sequencing methodology • BidirectionalDNA sequencing of fosmid clones (~ 10,000 sequences per depth) • ~ 64 Mbpof DNA sequence total Metagenome Statistics
Questions: Differences in the environmental parameters microbial community composition? Dominant populations? Functional variations ? Abundance profile differences?
Community similarity based on genus count Compare Genome Genome Clustering Genus, Hierarchical Clustering / PCA
Phylogenetic Distribution Compare Genome PhyloDistMetagenomesvs Genomes Gene Count (60+) 10 m 130 m 770 m 4,000 m Virus
Phylogenetic Distribution Compare Genome PhyloDistMetagenomesvs Genomes Gene Count (60+) 10 m 130 m 770 m 4,000 m Cren Nano Eury
Phylogenetic Distribution Compare Genome PhyloDistMetagenomesvs Genomes Gene Count (60+) 10 m 130 m 770 m 4,000 m Actino Bacteroidetes Cyano Firmic Planctomyc Proteo Verruco Chloroflex
Phylogenetic Distribution Compare Genome PhyloDist Radial Tree Customize (Phyla) / Bar Upper (10 m) Chloro Max. (130 m) Abyss (4,000 m)
Gene of interest Find Genes Gene Search “rhodopsin”
Gene of interest Find Genes Gene Search “nitrogenase” ? *
Function Profile Find Function COG Browser Click "Flagellum structure and biogenesis" Search All Add Selected to Function Cart Compare GenomesFunction ProfileView Function vs. Genomes Search Name for "type" *
Function Profile Find Function COG COG Browser “Cell Motility” Search COG Name “Type”Select all / Add to Function Cart Compare genomes Function Profile View Functions vs. Genomes Filter “Flagellar” * *
Function Profile Find Gene Gene Search “Transposase”
Conclusion: • Differences in the environmental parameters microbial community composition? • Light (rhodopsin) • Nutrients (nitrogenase) • Dominant populations? • Proteobacteria • Functional variations? • Flagellar proteins – no pattern • Transposase – abundant at depth • Abundance profile differences? • Cyanobacteria