Download
1 / 8
80 likes | 165 Views
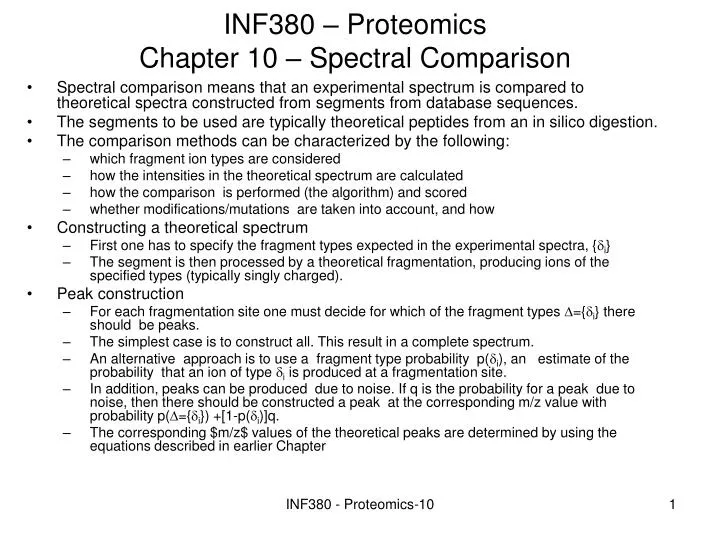
INF380 – Proteomics Chapter 10 – Spectral Comparison. Spectral comparison means that an experimental spectrum is compared to theoretical spectra constructed from segments from database sequences. The segments to be used are typically theoretical peptides from an in silico digestion.

E N D
INF380 – Proteomics Chapter 10 – Spectral Comparison • Spectral comparison means that an experimental spectrum is compared to theoretical spectra constructed from segments from database sequences. • The segments to be used are typically theoretical peptides from an in silico digestion. • The comparison methods can be characterized by the following: • which fragment ion types are considered • how the intensities in the theoretical spectrum are calculated • how the comparison is performed (the algorithm) and scored • whether modifications/mutations are taken into account, and how • Constructing a theoretical spectrum • First one has to specify the fragment types expected in the experimental spectra, {di} • The segment is then processed by a theoretical fragmentation, producing ions of the specified types (typically singly charged). • Peak construction • For each fragmentation site one must decide for which of the fragment types D={di} there should be peaks. • The simplest case is to construct all. This result in a complete spectrum. • An alternative approach is to use a fragment type probability p(di), an estimate of the probability that an ion of type di is produced at a fragmentation site. • In addition, peaks can be produced due to noise. If q is the probability for a peak due to noise, then there should be constructed a peak at the corresponding m/z value with probability p(D={di}) +[1-p(di)]q. • The corresponding $m/z$ values of the theoretical peaks are determined by using the equations described in earlier Chapter INF380 - Proteomics-10
Peak intensities • The determination of the peak intensities can be done at three levels, resulting in different types of theoretical spectra (or spectra at different levels), • UT spectra] (Uniform Theoretical) All peaks have the same height. • FT spectra] (Fragment Theoretical) The height of a peak depends on the fragment type, meaning for example that all b-ions get the same height, but with a different height from y-ions. • RT spectra] (Residue Theoretical) Different heights are given to each peak of the same fragment type, depending on information about position, length, sequence, mass, etc, • These different spectra types are reflected in different methods for spectral comparison and scoring. • One can quickly construct UT-spectra (or FT-spectra) and compare to the experimental spectrum. If a theoretical spectrum is giving a high score, one would go on to a more sophisticated scoring, based on the same type of information as for constructing RT spectra. Thus, this can be considered as a two-step procedure where the first step functions as a filter. • One can spend more time constructing RT spectra before comparison. INF380 - Proteomics-10
Non-probabilistic scoring • In this context, comparing spectra means comparing an experimental and a theoretical spectrum, though several of the scoring schemes were originally developed for comparing experimental spectra. • Note however that there is a difference between comparing two experimental spectra (for example, to examine whether they are generated from the same peptide) and comparing an experimental and a theoretical spectrum, as all expected fragment types are included in the theoretical spectra. • In the comparison two main methods are used. • Search for matching peaks. • Divide the m/z axis into intervals, and the integral intensities in corresponding intervals are compared. • The latter avoids the process of finding corresponding peaks, but a disadvantage is loss of precision and problems when the ion's mass is on the border of two intervals. • Scoring schemes typically include a sum of the scorings for each pair of matching peaks (or intervals), but often also a scoring component based on several matching peaks. • Different variants of these methods are used, from quite simple to more advanced. • Number and intensities of matching peaks or intervals • The simplest procedure for comparison is to process the spectra in parallel, counting the number of matching peaks. • This can easily be extended to taking intensities into account (either only from the experimental spectrum, or from both the experimental and theoretical spectra). One possibility is to calculate INF380 - Proteomics-10
Non-probabilistic scoring • We see that only intervals with intensities in both spectra effect the score. • The scoring scheme above has two components, the number of matches, and the intensities of the matches. It assumes a linear increase in scoring as the number of matches increases. • This means (if all peaks have the same intensity) that a comparison with eight matches is twice as good as a comparison with four matches. • This is unreasonable, since some of the matches may occur simply by chance. Underlying probability functions for the number of matches occurring by chance are typically exponential, indicating an exponential increase in the score as function of number of matches. • While this does not matter if all intensities were the same (the scores would arrange the segments in the same order), it has effects when the intensities varies. INF380 - Proteomics-10
Non-probabilistic scoring • Spectral contrast angle • A spectrum can be represented as an n-dimensional vector, where n is the number of considered m/z-values (or intervals). The j'th component of the experimental spectrum is then IjR. • Two spectra can be compared by calculating the angle between the vector representations, called the spectral contrast angle. • Two equal spectra have a contrast angle of zero, and 90 degrees indicates the maximum spectra differentiation. • Spectral contrast angle is mainly used to identify spectra produced by the same peptide, • Cross-correlation • A common function for calculating the correlation between any two signal series is the cross-correlation function. • For spectra in our context it can be formulated as • where t is a relative displacement between the spectra. • The simplest way to calculate the similarity (or correlation) is to use the correlation value for t=0 (corresponding to the number of matching peaks when intensities are considered). • It has however been found that subtracting the mean of the cross-correlation function over a range -k<t<k from the t=0-value gave better discrimination between similar spectra and was less sensitive to the purity of the samples. • In \cite{Eng-JAM94} it was found empirically that 75 is a suitable value for k for MS/MS data. • For efficient calculation of this function for many t, a Fourier transformation can be used. R and T are Fourier transformed, one of them converted to its complex conjugate, and multiplication performed. The result is then inversed Fourier transformed, to get the final value Ct for many t. INF380 - Proteomics-10
Sequest scoring • Since several of the statistical and assessment analyses for MS/MS spectra use results from SEQUEST, we describe how SEQUEST scores its candidate segments when searching in a database. • It has two types of scorings, first a preliminary scoring that is used to filter out segments having small probabilities for being the correct peptide. Then the remaining segments are scored by a final scoring scheme. • Preliminary scoring • The preliminary scoring uses b-and y-type continuity, and the presence of immonium ions. • The b- (y-) type continuity includes the number of matching peaks of type b-ion (y-ion) that also have a matching peak for the preceding b-ion (y-ion). If the total number of such peaks is C, a factor 1+Cb is included in the scoring (where 0.075 is used for b). • The immonium ions are scored by calculating a value ra for each of the amino acids a which are considered for the presence of immonium ions. INF380 - Proteomics-10
Sequest scoring – Final scoring • In addition to cross-correlation values, several other scoring components are calculated for identified segments. The most important ones are given below. • XCorr, the cross-correlation score. • dCn, the delta correlation value. The cross correlation values are normalized such that the highest correlationvalue is one. dCn for a candidate match is 1 - the normalized correlation value. It is of special interest to consider the dCn value for the second best match (second highest correlation value). • Sp, the preliminary score. • RSp, the rank the segment under consideration got in the preliminary scoring. • Ions, the number of matched peaks divided by the number of peaks in the theoretical spectrum. • dM, the difference between the experimental precursor mass and the mass of the segment under consideration. INF380 - Proteomics-10
Probabilistic scoring INF380 - Proteomics-10