Download
1 / 33
340 likes | 514 Views
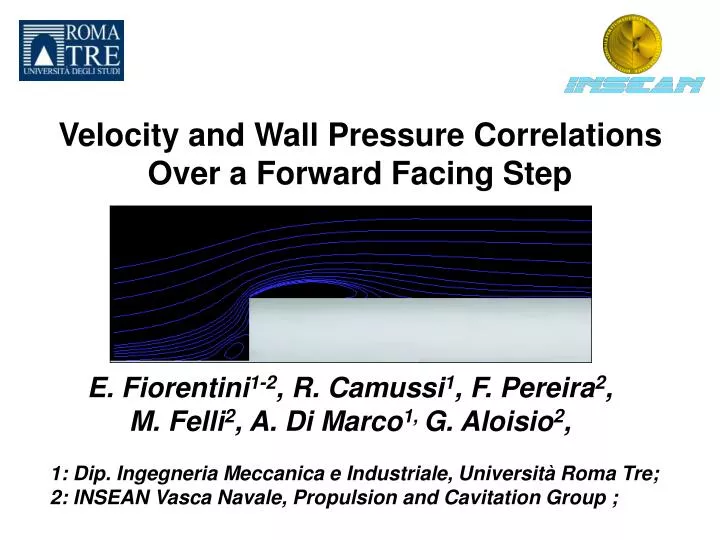
Velocity and Wall Pressure Correlations Over a Forward Facing Step. E. Fiorentini 1-2 , R. Camussi 1 , F. Pereira 2 , M. Felli 2 , A. Di Marco 1, G. Aloisio 2 ,. 1: Dip. Ingegneria Meccanica e Industriale, Università Roma Tre; 2: INSEAN Vasca Navale, Propulsion and Cavitation Group ;.

E N D
Velocity and Wall Pressure Correlations Over a Forward Facing Step E. Fiorentini1-2, R. Camussi1,F. Pereira2, M. Felli2, A. Di Marco1, G. Aloisio2, 1: Dip. Ingegneria Meccanica e Industriale, Università Roma Tre; 2: INSEAN Vasca Navale, Propulsion and Cavitation Group;
Outline • Background and motivations • Experimental set up: wall pressure fluctuations + time resolved PIV • Results and physical interpretations • Future perspectives
TBL separation and wall pressure fluctuations • Steps and geometrical irregularities are recognized as potential sources of aerodynamically generated noise; • The subject is of great interest from the viewpoint of practical and basic research applications; • Fluid dynamic and aeroacoustic complexity of the phenomenon, due to the presence of fluctuating pressure connected to both acoustic and pseudo acoustic contribution.
Geometrical irregularities Backward-facing step (BFS) Efimtsov et al., 2000 Lee & Sung, JFM 2003 …. Forward-facing step (FFS) Efimtsov et al. (1999) Leclerq et al. (2001) • Strong noise sourceat 5-6H, corresponding to the oscillating reattachment point of the flow • Noise 20 dB greater than the flat plate • Strong noise source: where? • Noise 30 dB greater than the flat plate
The shallow cavity studies(Camussi et al., JSV 2006, Exp. Fl. 2006) • The reattachment point at 5-6H and the FFS vertical wall are the most important noise emitting sources • The FFS is the noisiest zone Sound Pseudo-sound
Literature background • Efimtzov et al. (1999) studied wall pressure spectra downstream and upstream a FFS: they found that the most noisy region is just downstream the FFS • Leclerq et al. (2001) characterized a FFS-BFS sequence: they found that the largest SPL peaks are upstream the FFS Few works and contrasting results!
Objectives of the present study • Understand the physical mechanisms underlying the observed wall pressure statistics (understand → control) Hydrodynamic? Acoustic? • Correlate wall pressure pointwise measurements with PIV velocity fields
Experiment on a FFS • Measurements at the large scale recirculating water channel of INSEAN • Fully developed turbulent boundary layer (Camussi & Di Felice, Phys. Fl. 2006) with */h = 0.5 • Reh = U∞h/ = 440026300
Wall pressure measurements set up Array of pressure transducers Acquisition system PC Hydrophones + Accelerometer U = • fs = 1200 Hz, t = 400 sec, = 15 mm (0,75 h)
Pressure transducers flush mounted at the wall U • ENDEVCO 8510B-2 • Piezoresistive transducers • full scale range = 2 psi • sensitivity = 15050 mV/psi • resonance frequency = 70000 Hz • Ø= 3.8 mm
laser camera mirror Laser sheet Spherical lens Cylindrical lens step U Simultaneous pressure/PIV measurements set up Argon 6W SPECTRAPHYSICS Stabilite 2017 • Photron LTDFastcam APX • Up to 120.000 fps • CMOS sensor • 8 GB memory • fs = 1000 Hz • t = 12 sec • 1024x512 px
PIV post processing techniques • Time resolved (1000fps) • 2D FFT based cross-correlation • OFFSET method to resolve velocity gradients • Windows deformation • Multi-frame adaptive method (Romano & Di Felice)
Results • Averaged velocity & vorticity: overall behavior upstream & downstream of the step • Wall pressure statistics: overall SPL + auto-spectra + convection velocities • Pressure/velocity conditional statistics: ongoing activity (next AIVELA conference…hopefully)
Examples of averaged velocity fields Separations and reattachments upstream and downstream of the step
Averaged fields upstream of the step: streamlines and vorticity • Upstream separation point: xr h [Leclercq et al.: xr 0,8 h] • Reattachment at the vertical wall: • hr 0,5 h • [Leclercq et al.: hr 0,6 h] hr Reh = 4400 U∞ = 0,25 m/s xr
Averaged fields upstream of the step: streamlines and vorticity • Upstream separation point: xr h [Leclercq et al.: xr 0,8 h] • Reattachment at the vertical wall: • hr 0,5 h • [Leclercq et al.: hr 0,6 h] • xr and hr about constant with Re hr Reh = 17500 U∞ = 1 m/s xr
Averaged fields upstream of the step: vorticty and li structures Reh= 4400 Same behaviour for different Re
Wall pressure fluctuations upstream of the step: auto-spectra What we may expect? • Far from the step: quasi-equilibrium conditions inducing a power law with -1 exponent as an effect of turbulent structures in the outer layer (Bradshaw, 1967, Farabee & Casarella, 1991) • Close to the step: recirculation region with no advection effects – the classical -7/3 exponent should be present
Wall pressure fluctuations upstream of the step: auto-spectra U
Wall pressure fluctuations upstream of the step: auto-spectra U
Wall pressure fluctuations upstream of the step: auto-spectra U
Averaged fields downstream of the step: streamlines and vorticity • reattachment at xb 2,5 h • xb about constant with Re • Mohesen: xb 22,5 h • Leclercq et al.: xb 3,2 h • Farabee & Casarella: xb 34 h Reh = 4400 U∞ = 0,25 m/s xb
Averaged fields downstream of the step: streamlines and vorticity • reattachment at xb 2,5 h • xb about constant with Re • Mohesen: xb 22,5 h • Leclercq et al.: xb 3,2 h • Farabee & Casarella: xb 34 h Reh = 17500 U∞ = 1 m/s xb
Wall pressure fluctuations downstream of the step: auto-spectra • The slope decreases from -2.5 to -2 (in agreement with Leclerq et al.) - 2,5 - 2,5 U
Wall pressure fluctuations downstream of the step: auto-spectra • The slope decreases from -2.5 to -2 (in agreement with Leclerq et al.) - 2 - 2 U
Overall sound pressure level Maximum noise level • SPL increases close to the wall • Same trend for different Reynolds numbers U
Wall pressure fluctuations : further issues • Cross-correlations reveal acoustic (peak at 0 time shift due to the very high speed of sound) and hydrodynamic perturbations • The hydrodynamic convection velocity varies from 0,5 0,7 U∞ both upstream and downstream the step: the lowest magnitudes occur in the recirculation regions
Conclusions and future perspectives • An extensive data base has been generated: preliminary results clarify the overall dynamics • The Reynolds number seems to have a weak influence upon the separation/reattachment points • Wall pressure spectra reflect the influence of the recirculation regions as well as the hydrodynamic advection • The SPL reveals that the most noisy region is located downstream the step at the reattachment region! • Pressure-PIV data analysis: conditional analysis and ensemble averages would clarify the physical nature of the observed large SPL (also by the application of signal-processing advanced methodologies: Wavelet transform & POD)
laser camera mirror Laser sheet Spherical lens Cylindrical lens step U Simultaneous pressure/PIV measurements set up Array of pressure transducers Acquisition system PC Hydrophones+ accelerometer High speed camera Optics + mirror laser • fs = 1000 Hz • t = 12 sec • 1024x512 px
laser camera mirror Laser sheet Spherical lens Cylindrical lens step U Simultaneous pressure/PIV measurements set up • SPECTRA-PHYSICS Stabilite 2017 • Argon • max Power = 6 W
laser camera mirror Laser sheet Spherical lens Cylindrical lens step U Simultaneous pressure/PIV measurements set up • Photron LTDFastcam APX • Up to 120.000 fps • CMOS sensor • 8 GB memory
CONFIGURAZIONE DI MISURA: idrofoni idrofono a monte idrofono vicino al gradino