Download
1 / 23
230 likes | 464 Views
ELEMENTS OF MATHEMATICAL STATISTICS. ELEMENTS OF MATHEMATICAL STATISTICS. GENERAL NOTIONS Mathematical statistics is a set of methods that are used to collect, analyze group and interprete data concerning a certain phenomenon and predict its future evolution.

E N D
ELEMENTS OF MATHEMATICAL STATISTICS GENERAL NOTIONS Mathematical statistics is a set of methods that are used to collect, analyze group and interprete data concerning a certain phenomenon and predict its future evolution. THE STATISTICAL POPULATION is a definite set of similar objects. Elements of a statistical population are called statistical units or individuals. The part of the entire population for which the statistical analysis is made is called sample. CHARACTERISTIC ( or variable ) is the common feature of statistical population which we study in the statistical analysis. Characteristics are : - quantitative – if we can measure them (average , height) - qualitative – if we can`t measure them ( eyes color) .
ELEMENTS OF MATHEMATICAL STATISTICS THE QUANTITATIVE CHARACTERISTICS can be : - discontinuous – if the variable takes a finite number of values - continuous – if the variable takes any value from a finite or infinite interval For example : the average mean in mathematics takes values: 1, 2, …, 10 and is a discontinuous characteristic and height can take any value in a finite interval and is a continuous characteristic. STAGES OF A STATISTICAL STUDY (survey) - collecting data - presenting data in a table from which expresses answers, allows comparing and classifying - representing data - calculating specific parameters - interpreting data
ELEMENTS OF MATHEMATICAL STATISTICS TOTAL EFFECTIVE is the total number of the units of a statistical population. ABSOLUTE FREQUENCY of a value of the characteristic is the number of units corresponding to this value RELATIVE FREQUENCYof a value is the fraction between the absolute frequencyand the total effective. CUMULATIVE FREQUENCY ( increasing ) of a value of the characteristic is the sum of all relative frequencies of values up to and including this value
ELEMENTS OF MATHEMATICAL STATISTICS GRAPHIC REPRESENTATION OF DATA Representation of statistical series with discontinuous quantitative variable: - by columns (on the horizontal axis – values of the variable on the vertical axis - values of absolute frequency ). Representation of statistical series with continuous quantitative variable: - by histogram ( on the horizontal axis- succession of segments proportional to the length of classes; there are built rectangles having these segments as bases and height proportional to the absolute frequencies ) . EXEMPLES 1 2 3
ELEMENTS OF MATHEMATICAL STATISTICS Representation of statistical series with qualitative variable : - by structural rectangle ( it is divided into rectangles of areas proportional to relative frequencies ) , - by structural circle ( it is divided into circle sectors with areas proportional to relative frequencies ) , - diagrams with columns or bands ( rectangles with equal bases and heights proportional to the absolute frequencies, placed at equal distances from each other ). EXEMPLES 4 5 6 7
ELEMENTEDE STATISTICĂ MATEMATICĂ CHARACTERISTIC ELEMENTS OF A STATISTICAL SERIES The tables with the values of the characteristic and the corresponding absolute frequencies define the distribution of the statistical repartition of the statistical variable and represent a statistical series with only one variable. THE AVERAGE Considering the statistical variable x taking the values x1 , x2 , x3 , … xk with the corresponding effectives n1 , n2 , n3 , … nk Definition We call the average of the characteristics the number _ n1 x1 +n2 x2+…+nkxk x= ——————————— n1 +n2 +…+nk EXEMPLU
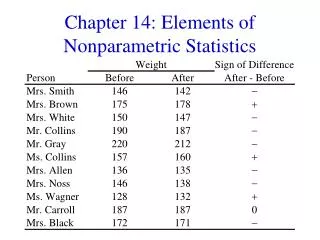
ELEMENTEDE STATISTICĂ MATEMATICĂ ~ Definition THE MEDIAN x , is a value for which half of the values xi are smaller or equal and the other half of the values xi are bigger or equal to that. Definition THE MODULUS ( or THE DOMINANT ) of a statistical series is the value of the characteristic corresponding to the highest frequency, in case of discontinuous values and the main value of the class corresponding to the highest frequency in case of continuous values. EXEMPLU
Marks in Mathematics BACK TABLE
Marks in Mathematics BACK CHART
Height BACK TABLE
Height BACK CHART
Distance from home to school BACK TABLE
Distance from home to school BACK CHART
Eye colour Blue Green Brown Black 10% 28% 52% 10% BACK TABLE
Eye colour CHART BACK
Favourite sport BACK TABLE
Favourite sport BACK CHART
Favourite music BACK TABLE
Favorite music BACK CHART
Birth month BACK TABLE
Birth month BACK CHART
Survey carried out bystudents and staff of National College “August Treboniu Laurian” Botosani