Download
1 / 19
190 likes | 292 Views
Intensification of Summer Rainfall Variability in the Southeastern United States in Recent Decades. Hui Wang 1,2 , Wenhong Li 1 , and Rong Fu 1,3 1 Georgia Institute of Technology 2 NOAA Climate Prediction Center 3 University of Texas at Austin.

E N D
Intensification of Summer Rainfall Variability in the Southeastern United States in Recent Decades Hui Wang1,2, Wenhong Li1, and Rong Fu1,3 1Georgia Institute of Technology 2NOAA Climate Prediction Center 3University of Texas at Austin NOAA’s 33rd Climate Diagnostics and Prediction Workshop and CLIVAR Drought Workshop October 20–24, 2008, Lincoln, Nebraska
Highlights: • Intensified SE rainfall variability in recent 3 decades. • Consistent with the shift of rainfall PDF. • Closely tired to the Atlantic SST variability. • Certain predictability based on tropical SST.
Background: Summer droughts repeatedly struck the Southeast in recent decades. 2007 Southeast drought – Worst in 100 years Lake Lanier – main water source for Atlanta • Questions: • Has the rainfall variability been intensified in recent decades? • What might cause the intensification?
Previous works: • Stahle & Cleaveland 1992: decade-long spring rainfall extremes have been a prominent feature of SE US over the past 1000 yrs. • Mo & Schemn 2008: model simulations show seasonally varying ENSO forcing on SE US; • Seager et al. 2008: model simulations show weak connection with SSTA, thus low predictability
Data Precipitation CPC U.S. Unified Precipitation (1948–1998, 0.25o x 0.25o) CPC realtime U.S. Daily Precipitation Analysis (1999–2007) SST NOAA Extended Reconstructed SST (ERSST v3, 2o x 2o) Wind and height NCEP/NCAR Reanalysis (850 and 200 hPa, 2.5o x 2.5o) Period JJA 1948–2007, 60 years
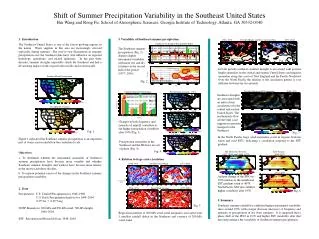
JJA Rainfall & Variability Part 1 Southeast: Large mean rainfall High variability Data: 1984–2007 CPC
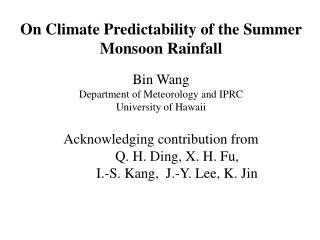
Change in SE Rainfall Variability Normalized JJA Precipitation Anomaly 1 stdv=0.64 mm/day Year
Standardized Precipitation Index: SE SPI (3-month) SE SPI (3-month) Moderately to extremely wet/dry 4 : 11 Severely to extremely wet/dry 1 : 3 2nd 30 yrs 1st 30 yrs SE SPI (9-month) SE SPI (9-month) Moderately to extremely wet/dry 5 : 14 Severely to extremely wet/dry 1 : 7
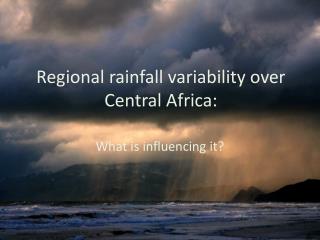
Shift of Rainfall PDF 2nd 30 years: Decrease of frequency and intensity in dry summers. Increase of frequency and intensity in wet summers. 60 yrs 1st 30 yrs 2nd 30 yrs Climatology Wet (5) Wet (5) Dry (5) Dry (5) 2nd 1st clm 1st 2nd Frequency 2nd 1st clm 1st 2nd 2nd 1st clm 1st 2nd 5 12 1 8 15 11 Bootstrap test Difference at 5% significance level Difference at 11% significance level Intensity
Warm Season Rainfall Midwest floods Southeast and Midwest: out of phase
Composite: Drought-related Large-scale Circulation Regression vs. SE precip index JJA 1948–2007 Contour: u200 Shading: z200 LLJ Shading: prcp Vector: wind 850 Contour: div 925
Change in Zonal Wind Variability at the Jet-Steam Level 1st 30 yrs 2nd 30 yrs
Co-variability of SE Rainfall with SST Homogeneous correlation map Part 2 ENSO PCF SST SVD Mode 1 ATL Zonal Mode ATL SST SVD Mode 2 ATL SST SVD Mode 1 Warming Trend
200-hPa Zonal Wind Variance: 1st 30 yrs vs. 2nd 30 yrs 1st 30yrs ENSO SST ATL Zonal Mode Warming Trend 2nd 30yrs
SVD Time Series ENSO R= 0.63 Variance SSTUS precip ATL zonal Mode R= 0.58 Variance Warming R= 0.60 Variance
Reconstruction of SE Precipitation Index Total (R=0.92) ATL ZM (R=0.87) Warming (0.63) ENSO (R=0.39) Correlation with OBS Multilinear regression based on SVD precipitation time series. ENSO dominant
Part 3 Empirical Forecast System 1. Project SST (OBS or FCST) onto the SVD SST pattern SST projection coefficient 2. Based on SVD SST – US precipitation relationship, precipitation projection coefficient 3. Based on SVD precipitation pattern, forecast of precipitation anomaly Cross-Validation Anomaly Correlation: Hindcast vs. OBS 2 ATL modes ENSO Hindcasts: JJA 1948–2007 rainfall based on observed SST
“Forecast” of Precipitation Anomaly for JJA 2008 Based on Observed SST “Forecast” Observation Dry Dry Wet Wet
Summary • SE summer precipitation exhibits higher interannual variability in recent 30 years. • The shift of rainfall variability is linked to tropical Atlantic SST variability, suggesting certain predictability of SE summer rainfall based on tropical SST.